
This view allows the user to monitor pending messages, Deliverable Messages, Undeleted Messages, Active Senders, and Receivers count for the queues of applications in running state.
Queue Monitoring can be done from two views in Monitor Messages tab:
To track messages in the Monitor Messages section, enable the EnableMessageMonitoring property under QueueingSubSystem node in the Peer Server. Refer Enable Message Monitoring in the View Message Monitoring Logs section to see how to enable this from the Profile Manager perspective in eStudio.
Data view
This view shows the Queue Information in data form.
To start monitoring the queues, perform the following actions:
-
Select Filter Queues

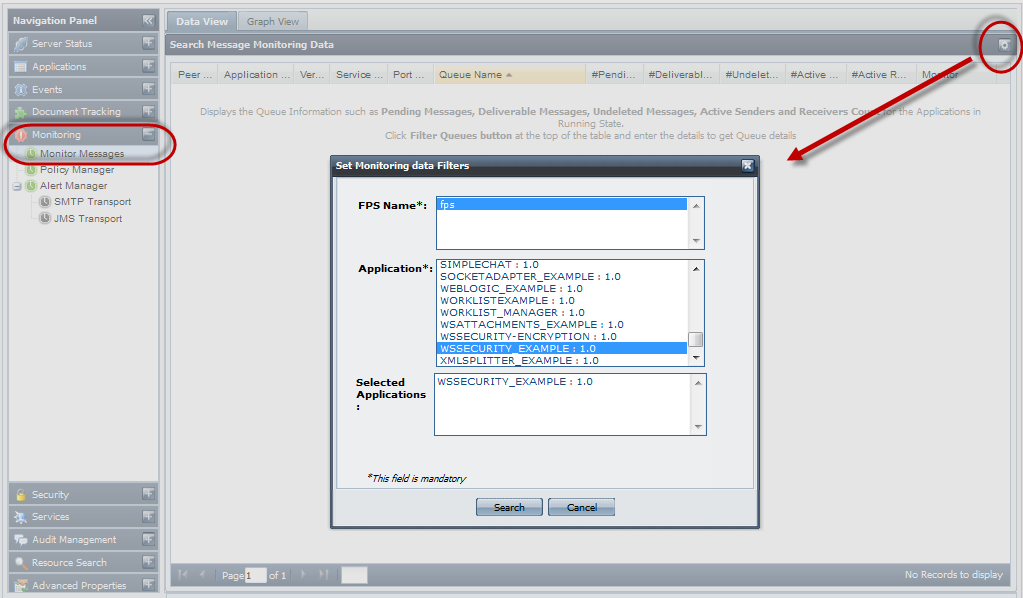
Figure 1: Setting Data Filters
-
Select PPS Name and Application and click the Search button as shown in the above figure; queues of the selected Applications will be displayed. Queue Information will be displayed on clicking the Enable Monitoring button
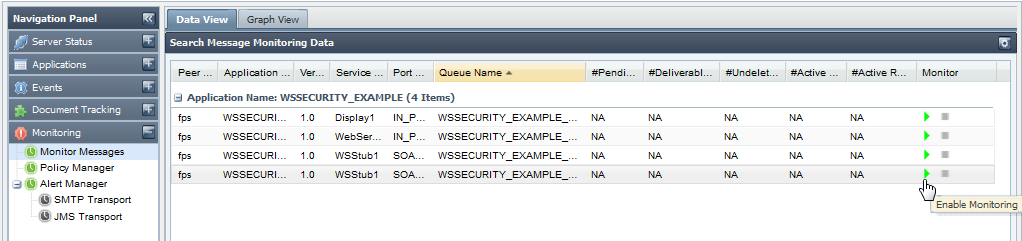
Figure 2: Enabling Message Monitoring
-
To stop monitoring a particular queue, click the Stop Monitoring button.
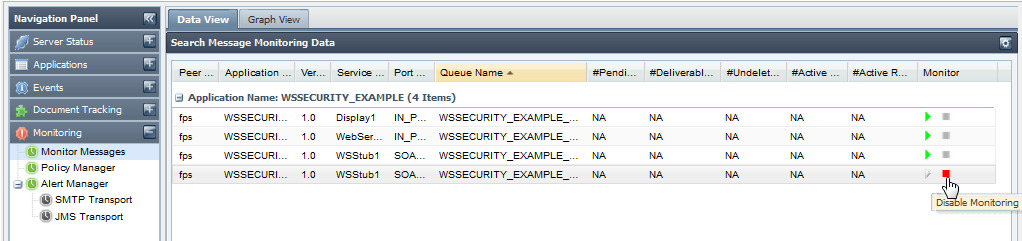
Figure 3: Disabling Message Monitoring
Graph View
Here the Queue Monitoring information is displayed in Graphical form. The Graph keeps on updating for every 5 seconds. Note that only one queue can be monitored at a time in Graph View.
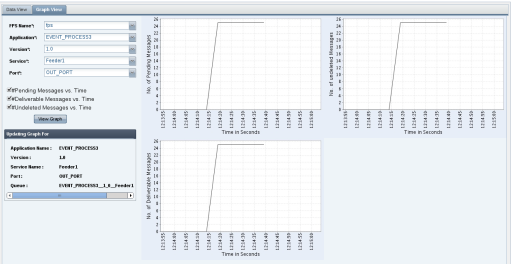
Figure 4 : Graph View