Fetching Server and Component Thread and Heap Dumps
Fetch Process ID
Server's Process ID
Get the server's JVM Process ID.
Server's Process ID is available in the console.

Figure 1: Server Console showing Server's Process ID
For servers running as service, the process ID will be available in the service logs being logged to the service.log file of the server
Microservice's Process ID
Process ID can be fetched for the microservices running as Separate Process using the following steps:
- Log in to the Dashboard and go to the Event processes tab under the APPLICATIONS section in the left navigation pabne.
- To open the particular event process that's running, select the Show only running processes option and filter by typing the event process name in the text box.
- Click the Details icon under the Actions column in the row that represents the running event process.

Figure 2: Event processes page
- From the Service instances tab, fetch the number from the Process ID column of the microservice.

Figure 3: Service Details
Server and Component Thread Dumps
In case a server/component is seen to be non performing due to any unforeseen reason, server/component thread dump can be taken, which helps the support team analyse and understand the issue because of which the performance is being affected. This section explains the procedure to fetch the thread dumps from a working Fiorano setup.
Server Thread Dumps from Dashboard
Follow the steps given below to get the server thread dump:
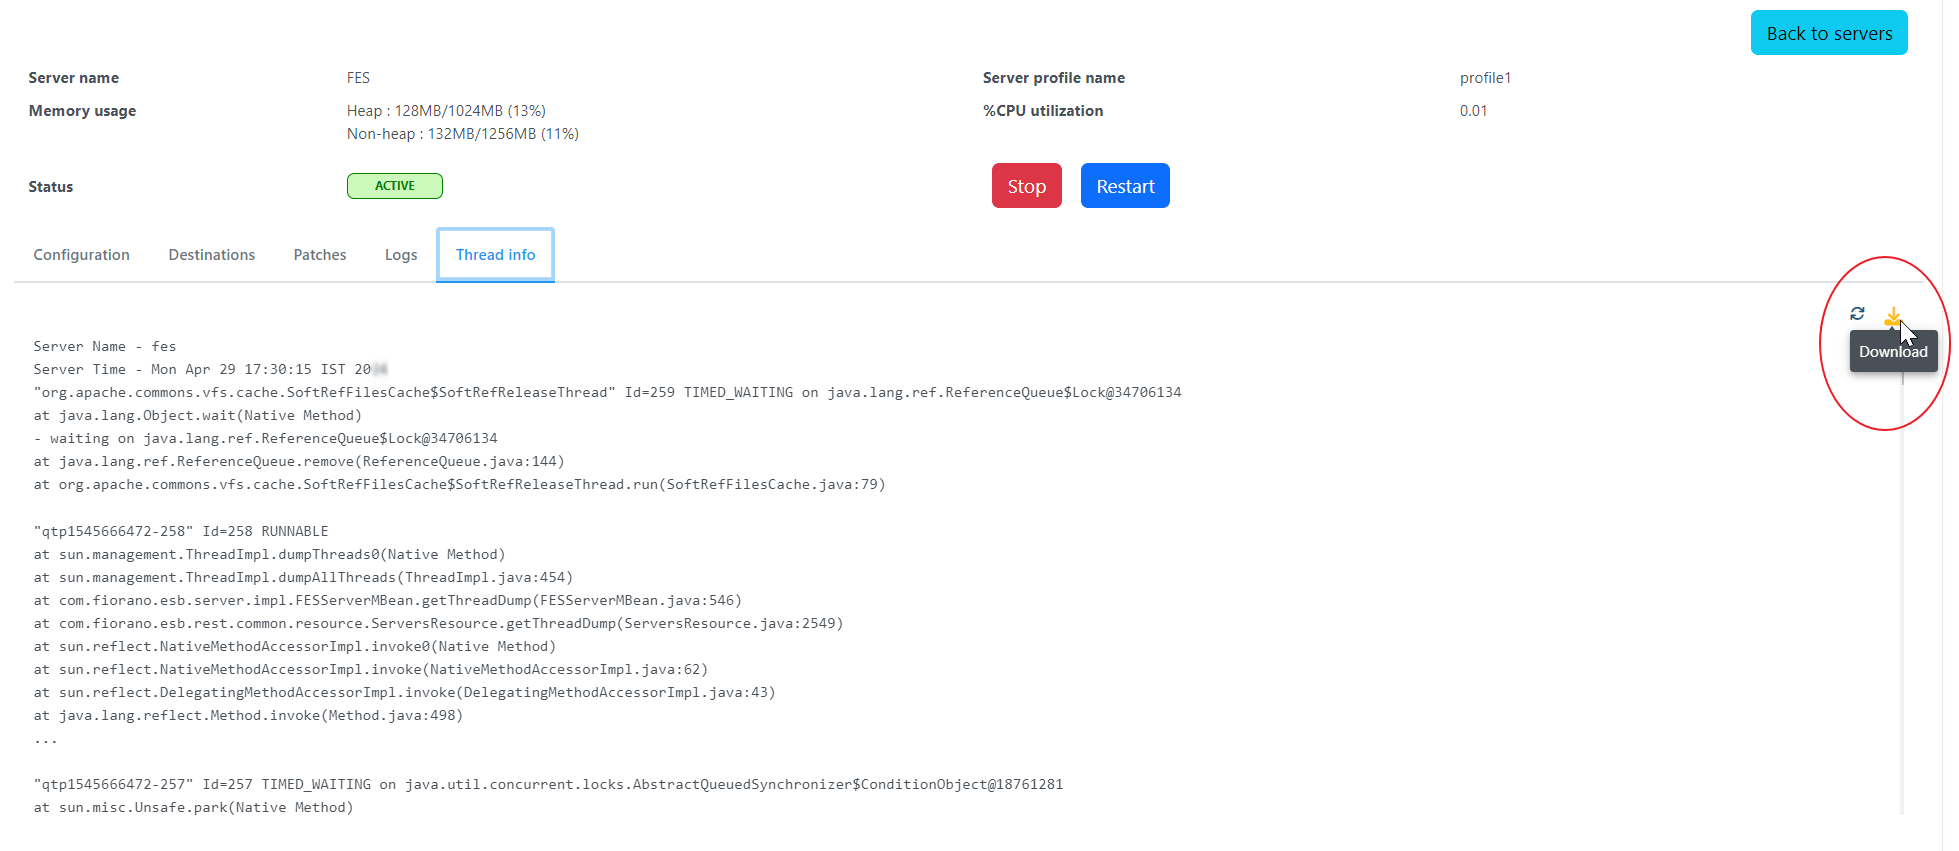
- Login to ESB Dashboard, go to the Enterprise servers page, and click the Details icon.

- Select the Thread info tab to see the thread dump.

- Click the Download icon.

Server Thread Dumps from JVM Process ID using jstack
After fetching server's process ID (refer to the Fetching Server and Component Thread and Heap Dumps#Fetch Server Process ID section), to get the thread dump using jstack, open a new console window and use the command below to store the thread dump to the threadDump.txt file:
jstack <pid> >> threadDump.txtIf the jstack command is not found in the command prompt, then go to the folder where jstack is present (in the Java installation directory, for example, C:\Program Files\Java\jdk1.8.0_121\bin) and run the above commands.
To analyze the status of the each thread of the server, take 5 times of threaddumps with a time interval of 5 seconds.
Component Thread Dumps from JVM Process ID using jstack
Fiorano suggests to use the open source tool 'VisualVM' to fetch the thread dumps from components running as a separate process. Alternatively, use jstack in-built in the JDK to get the thread dump.
Component Process ID can be fetched for components running as separate process using the following step:
After fetching component's Process ID, use the jstack command to get the thread dump of the component:
Figure: jstack Command
Server and Component Heap Dumps
Server Heap Dumps from JVM Process ID using jmap
After fetching server's process ID (refer to the Server's Process ID section), to get the heap dump using jmap, open a new console window and use the following command to store the heap dump to heapDump.bin file:
jmap -dump:format=b,file=heapDump.bin <pid> 
Figure: jmap Command
Component Heap Dumps from JVM Process ID using jmap
After fetching component's Process ID, use the jmap command to get the heap dump of the component:

Figure: jmap Command
