Monitoring Events and Tracking Performance
Event Monitoring feature helps to monitor the performance bottlenecks in real time where the possibility of any malfunctions can also be tracked. Monitoring can be done either by continuous tracking of performance or by registering particular cases, which when occur, an alert can be generated by means of an Email or a JMS Message.
Events that are raised in the Fiorano Network are mainly classified into two – Audit Events and System Events. These two events, its types and monitoring methods are explained in the following sections.
Audit Events
Fiorano provides visibility into the system and more importantly provides a means of accountability of the changes occurred on the system by analyzing audit events. In certain cases, it can also help in detecting security violations and in conducting an analysis on the logged information, which helps to find the root cause of problems.
Below table describes various audit events categorized based on the type of situations that the events monitor.
Audit Events | Description |
|---|---|
Authentication Event | This event is raised when the user tries to log into or create a connection with the server. This event can also be used to check if someone is trying to hack into the system by trying some random username/password combinations. |
Authorization Event | This event is raised when the user tries to perform an operation that is protected by permissions granted to the user. For example, when you are denied of application launch permission and if you launch a application the admin will get an authorization event. |
Security Database Modification Event | This event is raised whenever there is a modification in the security database of the server. For example, user creation, user deletion, group creation, addition of a member to a group. |
Event Process Repository Modification Event | This event is raised whenever there is a modification in the Event Process Repository like changes made to an Event Process, deletion of an Event Process, adding an Event Process to the repository. |
Service Repository Modification Event | This event is raised whenever there is a modification in the component repository of either the Enterprise Server or any of the Peer Servers. Each Peer Server maintains its own local repository of components that gets modified at the time of the CRC (Connectivity and Resource Check) operation. |
Event Process Life Cycle Event | This event is raised whenever there is a change in the status of an Event Process, for example transition from 'stopped' to 'launched' state. |
Component Life Cycle Event | This event is raised whenever there is a change in Component life cycle, for example from stopped state to running state or vice-versa. |
Principal Store Synchronization Event | This event is raised whenever a peer server synchronizes its principal store with that of Enterprise Server. On successful connection, the Enterprise Server sends a command to the Peer Server to synchronize its Principal Store with that of the Enterprise Server. This command can also be issued via Dashboard to force principal store synchronization. |
Alert Repository Modification Event | This event is raised whenever there is a modification in the alert repository. For example, deletion of an Alert, adding new Alert to the repository. |
Debugger Auditing Event | This event is raised whenever there is a creation/deletion of debug routes in an event process. This event is also raised if there is any message modification/deletion on debug routes. |
Monitoring Audit Events
Enabling Audit Policies
To enable audit policies, perform the following actions:
- Login to Dashboard, expand Audit Management in the Navigation Panel and select Policies, and select a policy name under Audit Policies Panel on the right.
- In the bottom panel, select the Event Status, Event Category and Audit Event ID, and click the Save Changes button (Select the checkboxes individually or click the All link present above the options to select all). After the Policy gets saved, the value under Policy Status column turns ACTIVE from PASSIVE.
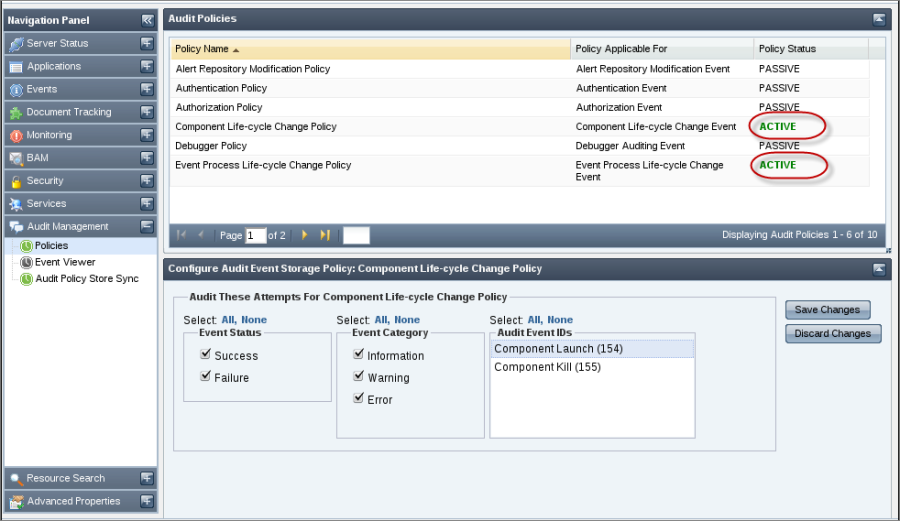
Figure 1: Enabling Audit Policies
Viewing Audit Events
After the Policy gets activated, the respective events generated can be viewed in Audit Management > Event Viewer. To view the event details, perform the following actions:
- Click the Filter Events icon present in the upper-right corner of Unified Audit Event Viewer page.
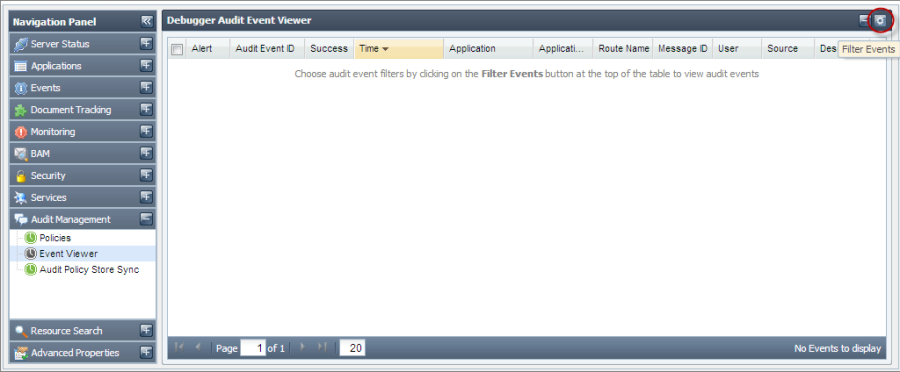
Figure 2: Opening Filter Events dialog box - In the setEventFilters Window, select the required fields to filter it for searching and click the Search button.
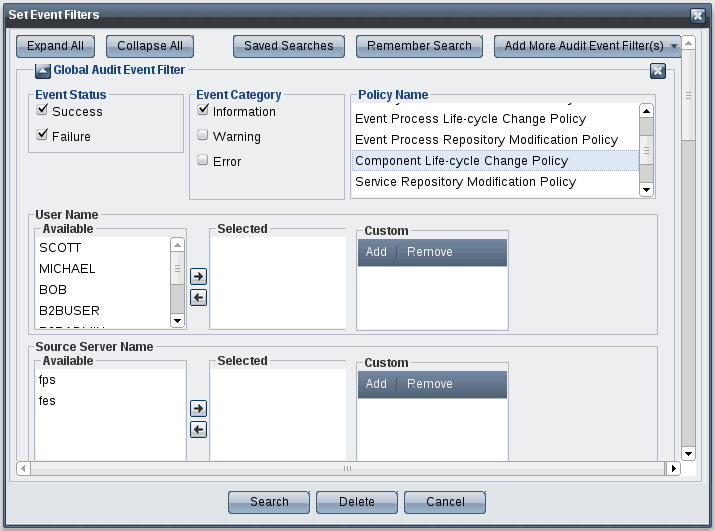
Figure 3: Search Events - The Events matching the search criteria will be listed in the Unified Audit Event Viewer page.
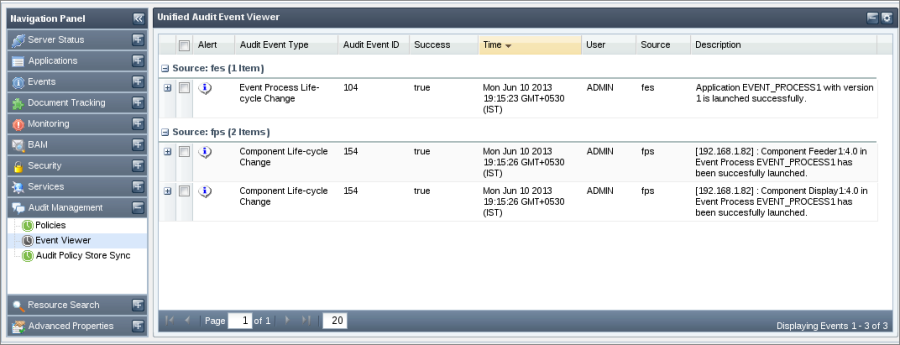
Figure 4: Event Viewer
Audit Policy Store Synchronization
This view shows the result of synchronization of audit policy store operation. A synchronized audit policy store means that the same audit policies (as in Enterprise Server) are active in peer servers as well. If stores are not synchronized, the status field will display 'false' and the reason for which the synchronization could not be achieved will be displayed under Comment column. At this instance, you have to take corrective action.
You can force re-synchronization of audit policies with a particular peer server by clicking the image present under the Synchronize column.
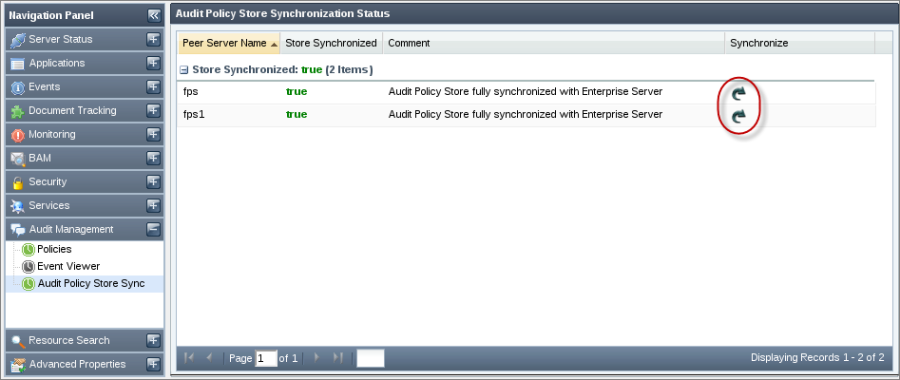
Figure 5: Audit Policy Store Synchronization
System Events
System Events have an important place within the Fiorano System since they determine how the system behaves in a particular/specific situation.
Below table describes about various system events which are categorized based on the type of situations that the events monitor.
System Events | Description |
|---|---|
Application Event | Enterprise Server generates this event when an application is launched, killed, created, saved, or deleted. Application launch and kill events are also handled by Peer Servers. |
Service Event | Peer Servers generates this event by whenever a service instance is launched or killed. |
User Event | Business Components for whom monitoring configuration has been enabled generates this event. |
Security Event | Enterprise Server generates this event whenever a user action results in security violation (as determined by ACL for that particular user) in Enterprise server. |
Service Repository Updation Event | Enterprise Server generates this event whenever some modification is made to Service Repository of Enterprise Server. For example, registering a new service, addition of a resource to an existing service. |
SP Event | Enterprise Server raises this event at the time of startup and shutdown. |
TPS Event | Both Enterprise and Peer Servers raise this event when the Peers connect/disconnect from Enterprise Server. On receiving this event from a Peer Server, Enterprise Server synchronizes the states of all concerned Event Processes with that Peer Server. |
Backlog Monitor Event | Peer Servers generates this event whenever configured backlog level is reached as defined by backlog policies active on that Peer Server. |
Low Memory Event | All the Fiorano Servers generates this event whenever they detect that memory usage of server has crossed the specified threshold. |
SBW Event | Peer Servers raise this event whenever a message reaches a port on which document tracking is enabled. On receiving these events from Peer Servers, Enterprise Server stores them into configured document tracking database.' |
Gateway Event | In the Case of HA Servers running in multiple machines, Enterprise Server generates this event whenever the gateway machine is up/down |
Monitoring System Events
Monitoring events by SMTP/JMS Alerts
The events that can be monitored by using SMTP/JMS alerts are Application Events, Service Events, Security Events, TPS/FPS Events, SP/Enterprise Server Events, Security Events, and Gateway Events.
SMTP Alert Registration
To add an Alert Configuration, perform the following:
- Click the Events tab form the Navigation Panel and choose SMTP Alert Registration option.
- Click the Add an Alert Configuration icon on the upper-right part of the SMTP Event Alert IDs page.
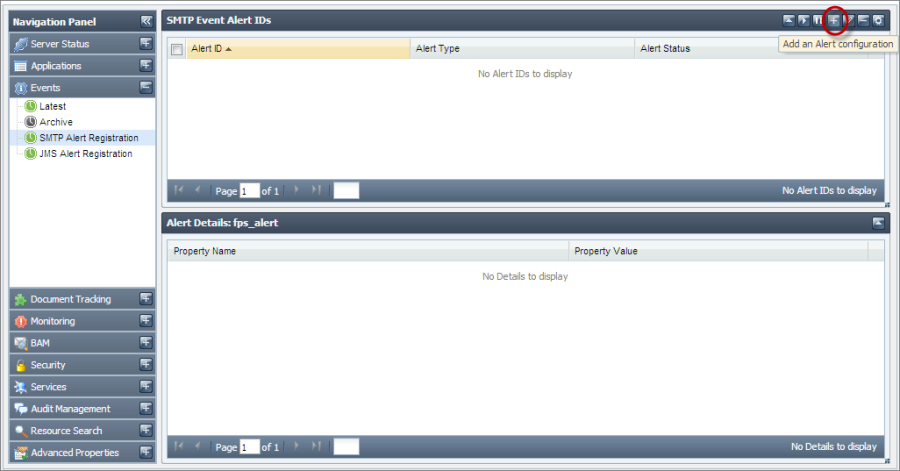
Figure 6: Add an Alert Configuration button In the Configure SMTP Alert dialog box, choose the Event Type and Event Category from the drop-down list and enter the email ID of the recipient in Recipient Address field (Multiple Recipient Addresses can be added separated by commas). Also add the subject that you want for the alert to appear on the mail in Subject tab, and add a unique number in Alert ID.
- For different Event Types, enter the corresponding options that appear.
- Warning alerts (Event Category) for any Event Type except Gateway will handle Error events as well.
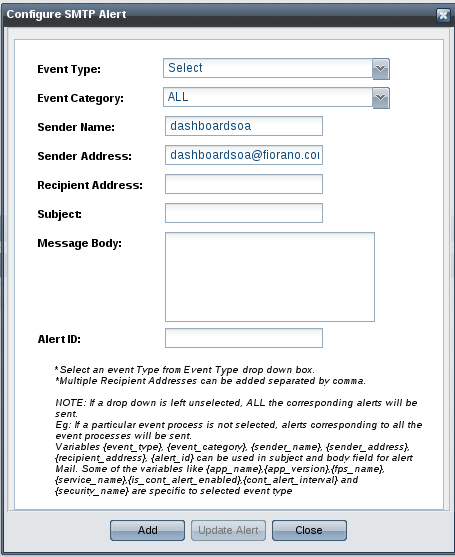
Figure 7: Configure SMTP Alert dialog box- Click the Add button to apply the changes. The list of currently configured email alerts and their details appear in the SMTP Event Alert IDs page.
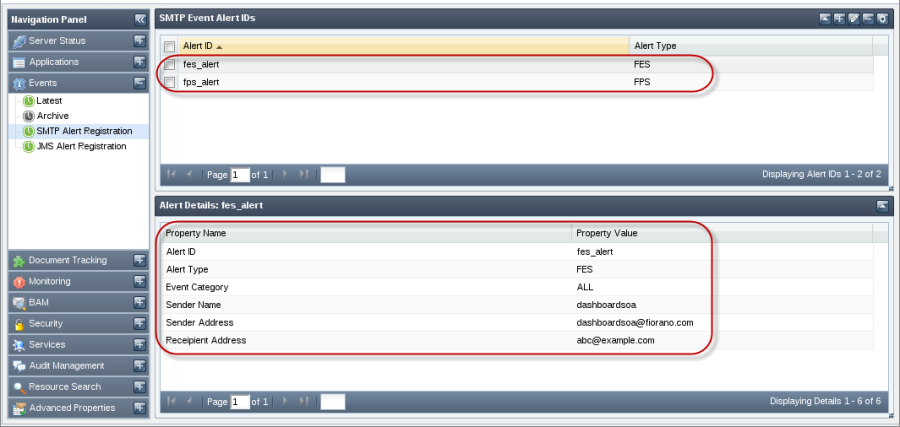
Figure 8: Event e-mail registration option
You can change the mail server configuration settings in Configure SMTP Server Settings window. This page also provides an option to specify username and password in case the mail server requires authentication of these in order to send e-mails.
To configure SMTP server settings, perform the following:
- Click the Events tab form the Navigation Panel to expand it, and choose the SMTPAlertRegistration option.
- Click the Configure SMTP Server Settings button present in the upper-right part of the SMTP Event Alert IDs page.
- In the Configure SMTP Server Settings dialog box, enter the details and click the Validate button. If the validation is successful, then click SaveConfigurations button to save the configurations and click Done.
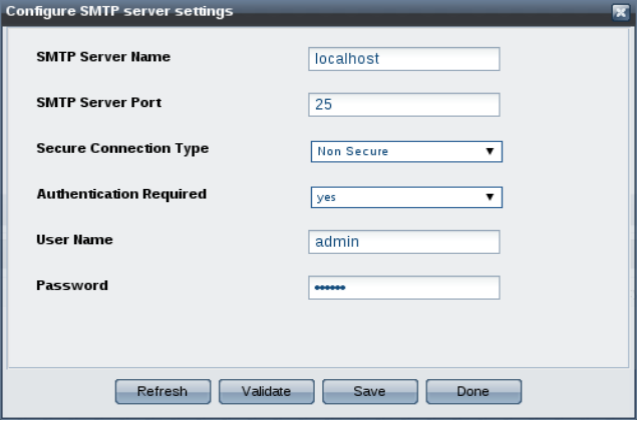
Figure 9: Configure SMTP Server Settings dialog box
JMS Alert Registration
You can configure the JMS server settings by going to the Configure JMS Server Settings window. This page also provides an option to specify usernames and passwords in case the JMS server requires authentication
To add an Alert Configuration, perform the following:
- Click the Events tab form the Navigation Panel to expand it and choose JMS Alert Registration option.
- Click the Add an Alert Configuration button present in the upper-right part of the JMS Event Alert IDs page.
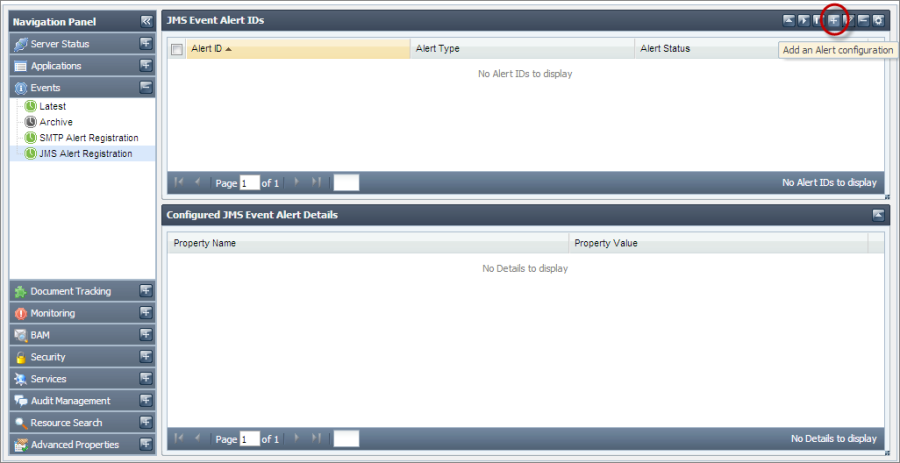
Figure 10: Add an Alert Configuration button - In the Configure JMS Alert dialog box, choose the Event Type and Event Category from the drop-down list, enter the Destination Name (can be new or existing destination) and enter unique ID in Alert ID.
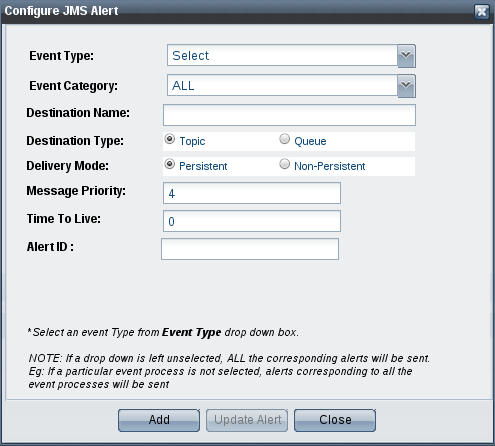
Figure 11: Configure JMS Alert dialog box - Click the Add button to apply the changes. The list of the JMS alerts configured appears in JMS Event Alert IDs page.
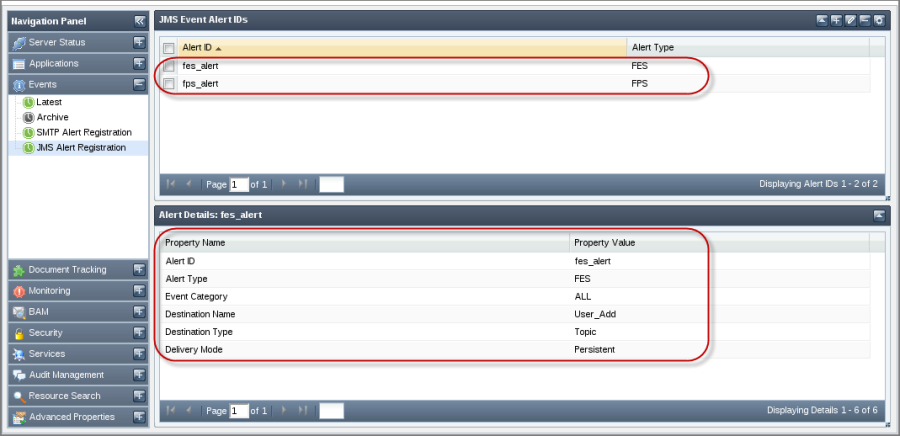
Figure 12: Event JMS registration option
To configure JMS Server settings, perform the following:
- Click the Events tab form the Navigation Panel and choose the JMS Alert Registration option.
- Click the ConfigureJMSServerSettings button present in the upper-right part of the JMS Event Alert IDs page.
- In the Configure JMS Server Settings dialog box, enter the details and click the Validate button. If the validation is successful, then click Save Configurations button to save the configurations and click Done.
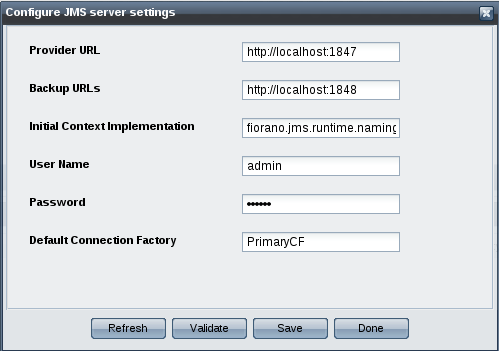
Figure 13: Configure JMS Server Settings dialog box
Monitoring Performance
Monitor the performance of services by enabling the monitor performance in component CPS.
To monitor user Events, apart from enabling Monitoring in the CPS, enable ListenForUserEvents parameter in the FES profile which can be done from eStuido or Dashboard itself. This property decides whether or not the Enterprise Server listens to the monitoring events published by component instances.
Performance statistics is available in two views: Data View and Grid View as explained below.
Data View
Navigate to Applications > Monitor Performance > Data View
This view shows performance messages sent by the components in data form.
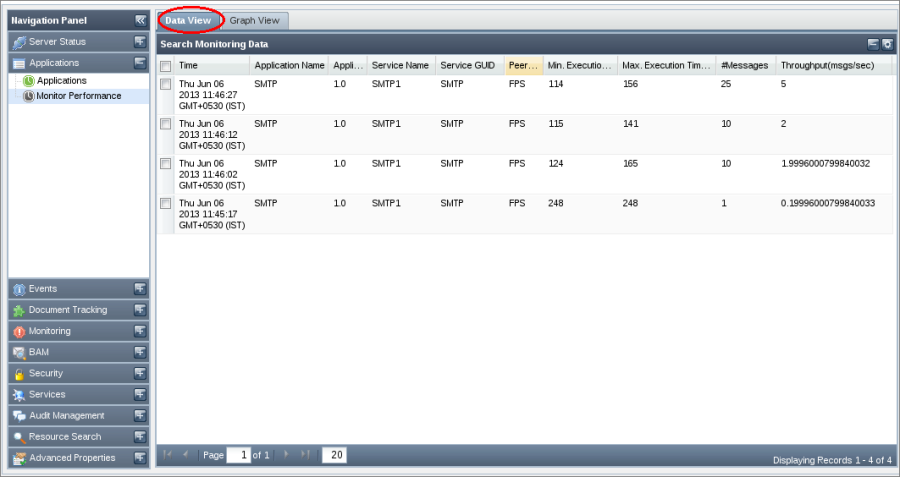
Figure 14: Data View tab
The components for which monitoring data should be displayed and the timeinterval for which it is displayed can be configured by clicking the Filter Events button present in the upper-right part of the Search Monitoring data section under Data View tab.
Graph View
In Graph View, the performance of the component is shown in the form of a graph. Graphs can be monitored for archived performance data or for the latest data. To show latest performance data, select live graph option. Maximum number of points plotted on the graph can be configured by specifying the desired value for the Max Points field. It is recommended using Firefox 2.0 or Internet Explorer as the browser to see Graph View.
Only one component can be monitored at a time in Graph View.
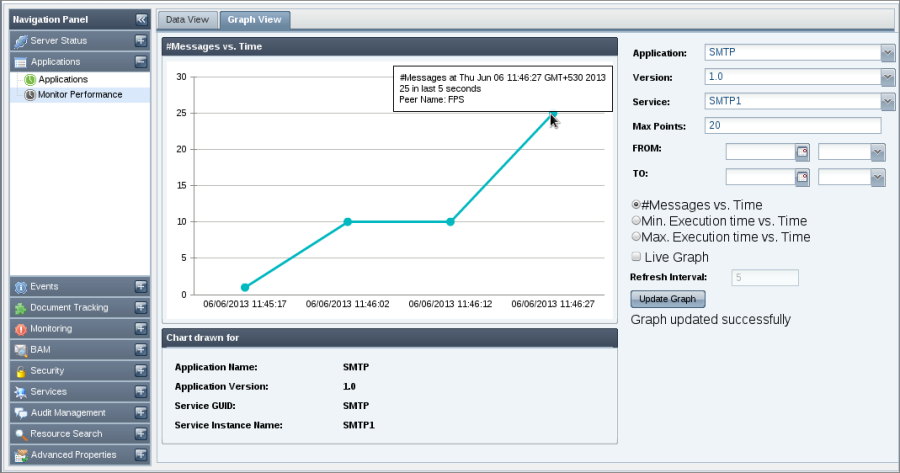
Figure 15: Graph View
Monitoring SBW Events
This section shows all the tracked documents in Fiorano Event Processes along with all details of the tracked document. Click Document Tracking under Navigation Panel to expand it and then select Application Documents to see the documents being tracked.
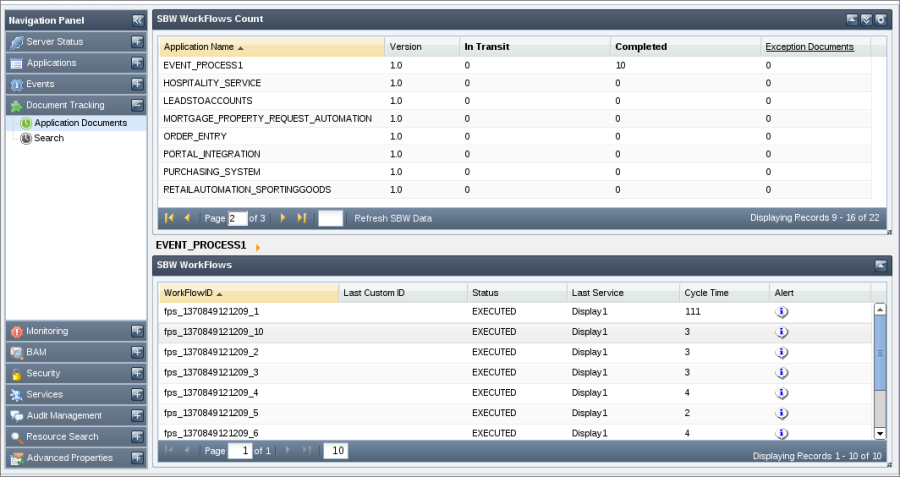
Figure 16: Document tracking tab showing tracked documents
The details of each tracked document can be seen by clicking the particular document. This shows the document details such as the component processing it, time stamps, document IDs and the originating port of the tracked document.
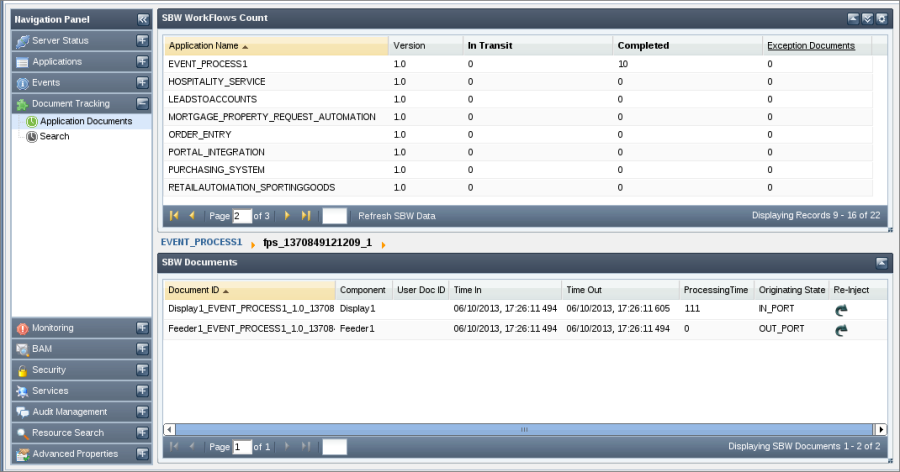
Figure 17: Details of the tracked document
Click on the particular Document ID to see the properties of the tracked document. This shows the tracked document message properties, details of attachments, application context, message body and other general properties.
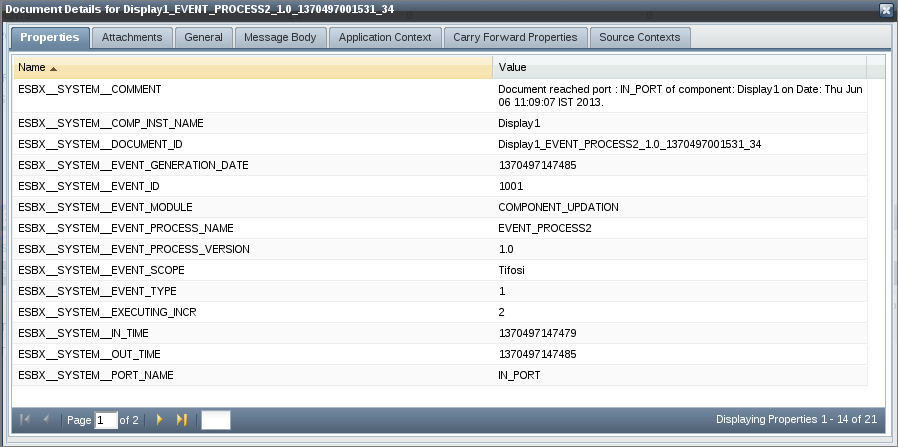
Figure 18: Tracked document
Application Level Document Tracking
Click the Enable/Disable Application Level Document Tracking button present at top right corner to enable/disable Document Tracking at Application Level.
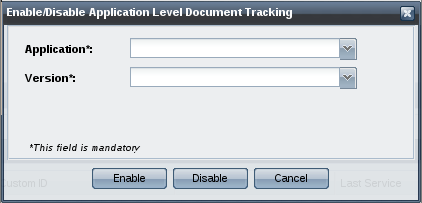
Figure 19: Application Level Document Tracking
The Dashboard supports searching for tracked documents based on various criteria such as Application Name, Peer Server Name, Document Status that is, EXECUTED or EXECUTING, Service Instance Name, and Port Name. In addition, the documents can be searched based on the date on which these were generated.
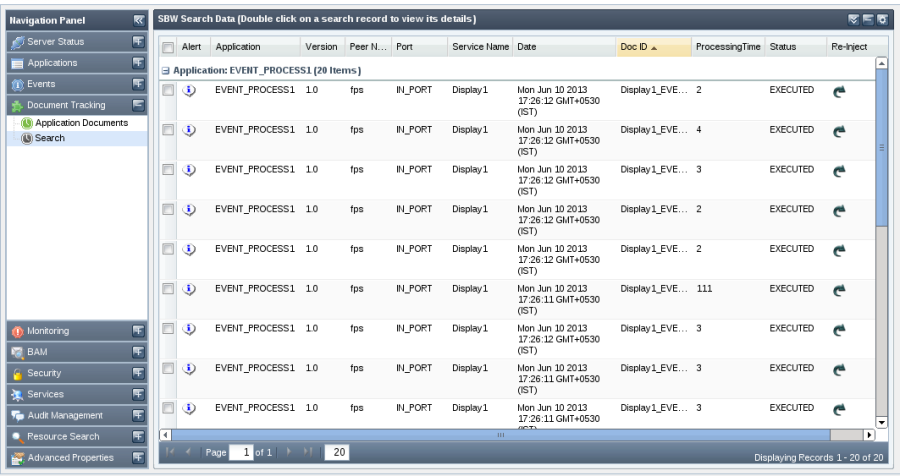
Figure 20: Searching tracked documents
Backlog and Low Memory Monitoring
The monitoring tab helps you add policies or alerts to monitor the Fiorano Network. The Monitoring tab has two sub-tabs:
- Alert Manager
- Policy Manager
Click Monitoring tab under Navigation Panel to use the two options as above.
Alert Manager
This section shows all the alerts that are present in the Fiorano Network. This section allows you to add new alerts, edit or delete an existing alert. Two types of alerts can be added:
- SMTP Alert
- JMS Alert
Click Add Alert icon present in the upper-right part of the Alert IDs page to add the alerts as above.
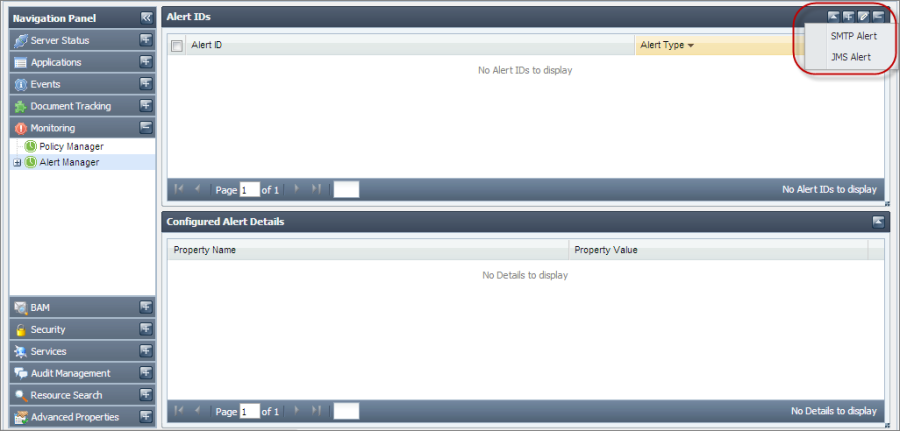
Figure 21: Alert Manager
Click Expand icon next to the Alert Manager tab to display the below sub-tabs:
- SMTP Transport
- JMS Transport
The above tabs allow specifying the transport settings that will be used for sending the alerts.
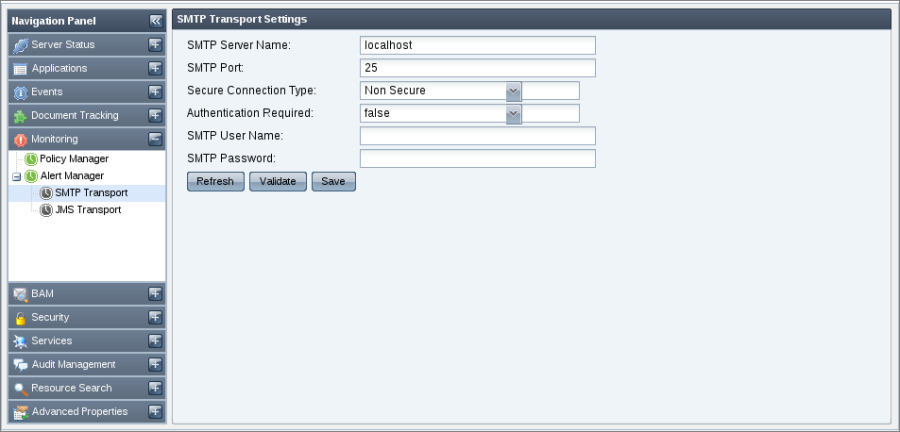
Figure 22: SMTP Transport
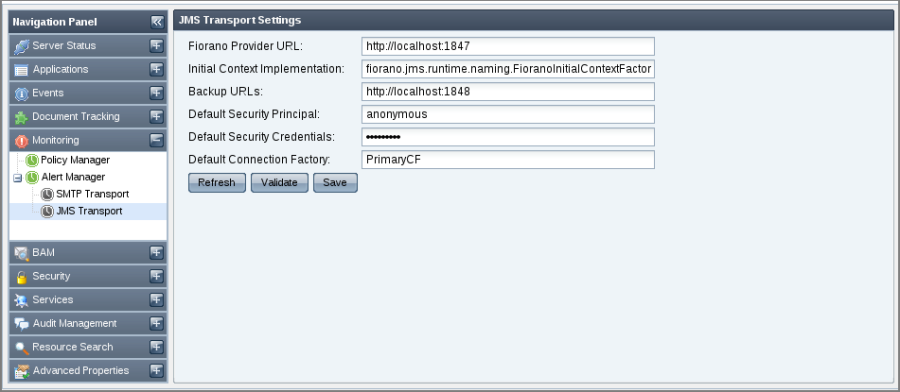
Figure 23: JMS Transport
Policy Manager
This tab shows all the policies that are present in the Fiorano Network. It allows you to add new policies, edit or delete an existing policy, apply or suspend existing policies. Two types of policies can be added:
- Backlog Policy
- LowMemory Policy
Click Add Policy icon present in the upper-right part of the Policy IDs page to add the policies as above.
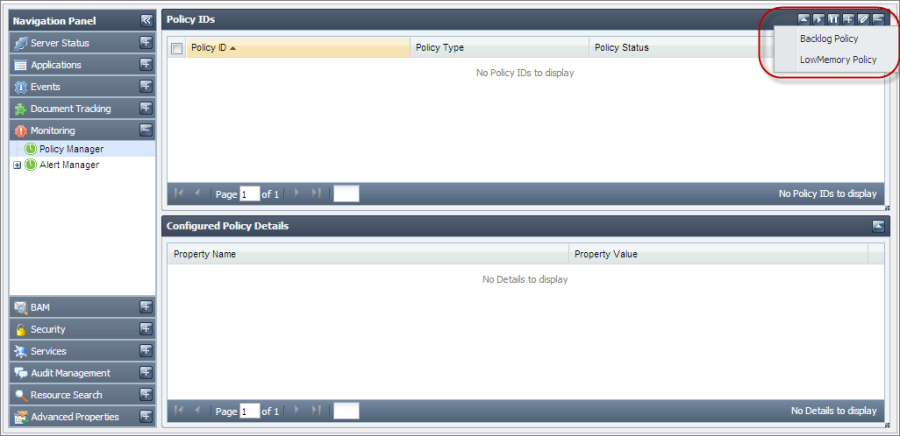
Figure 24: Policy Manager
