Trace View
Tracer helps to trace HTTP messages sent from an application to a proxy and it helps analyze data right from the starting of the request till a response received by the application.
Click the Deploy button and select the below option based on where tracing needs to be performed.
- Production with Trace
- Development with Trace

This may be done from any tab under the API Projects section. For example, this option is available in the Policies screen also.
Live Session
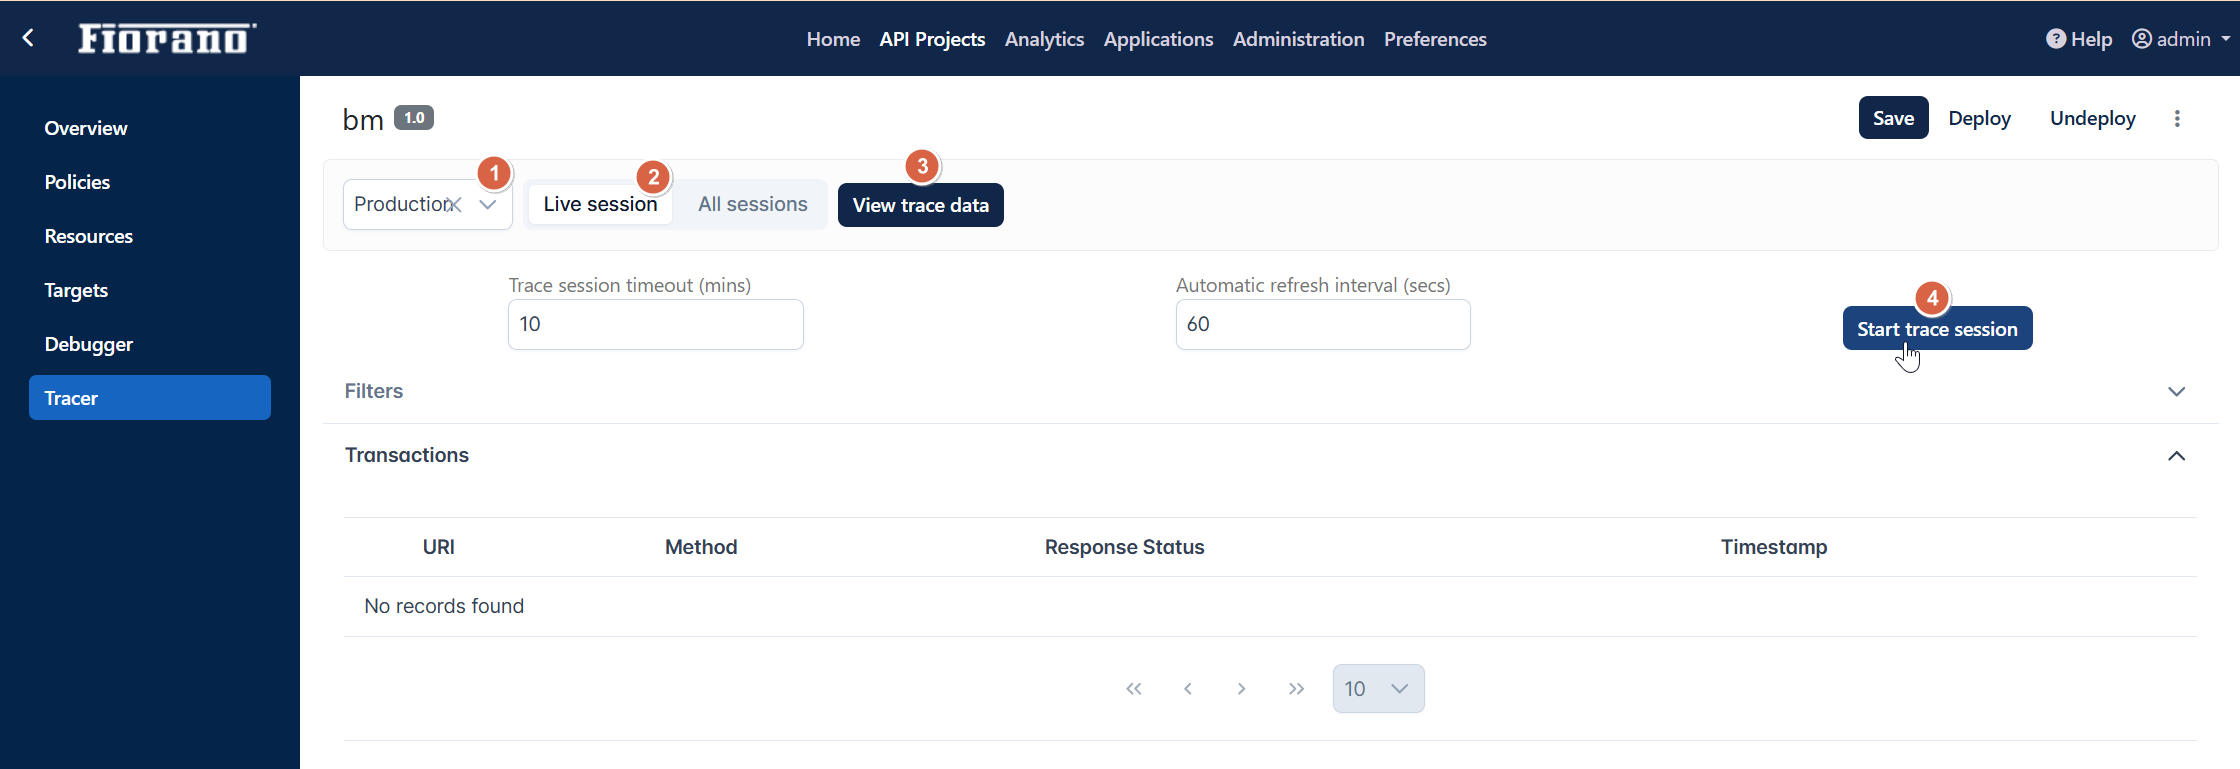
In the Tracer section,
- Select the respective server group from the drop-down.
- Click the Live session button and click View trace data.
- Provide the Timeout value depending on the time required till the tracing needs to be done. Elapsed Time can be seen next to the Timeout property.
- Click the Start trace session button to start tracing the request.

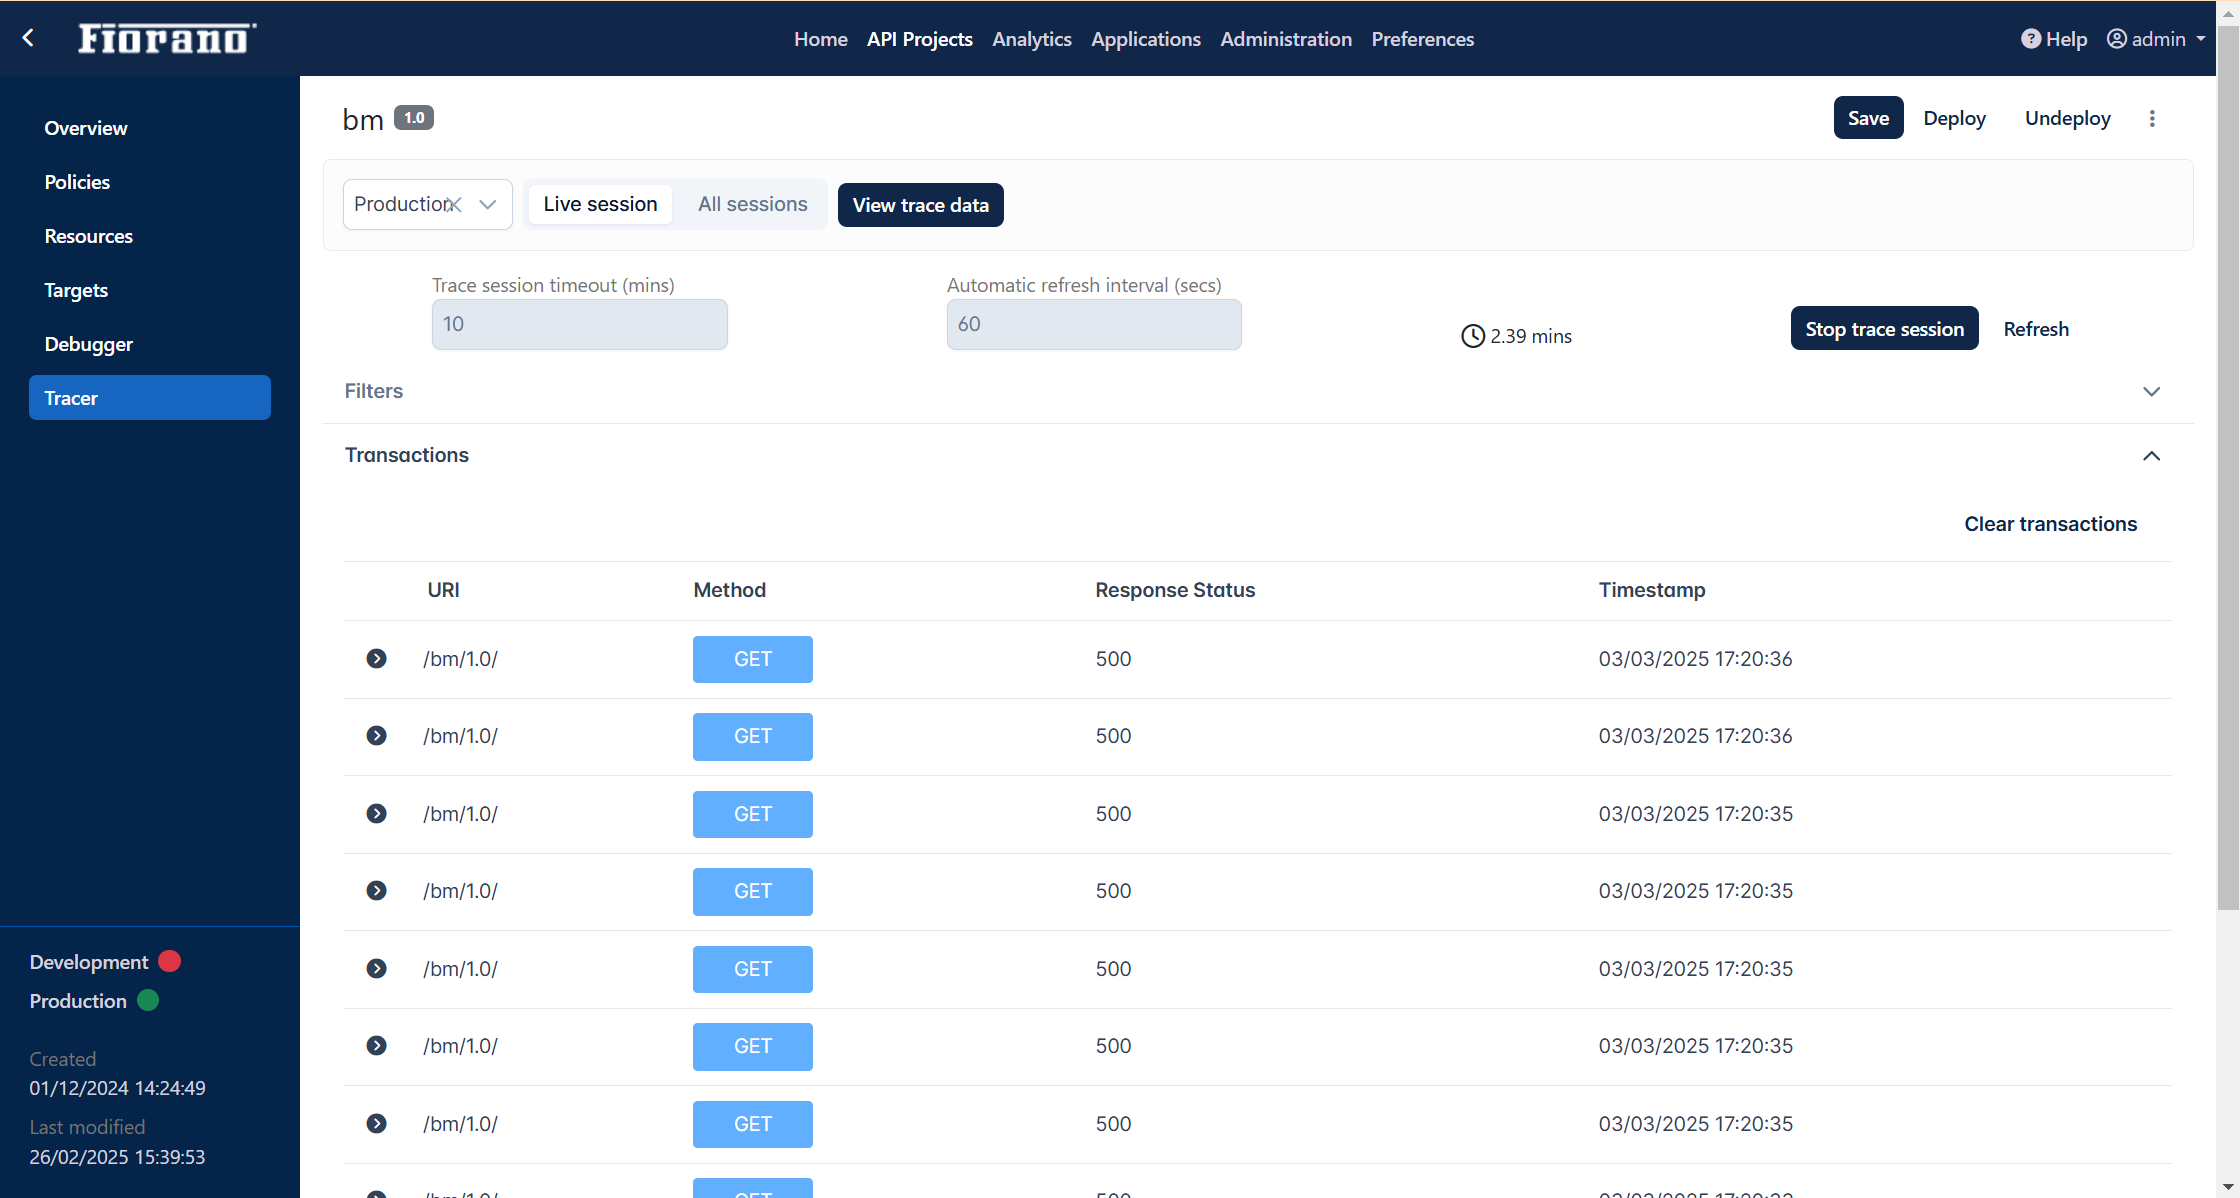
Whenever requests are sent, the details such as URI, Method, Status, and Timestamp appear under the Transactions table. These values get populated following the time interval as configured in the Automatic Refresh Interval or upon clicking the Refresh button.
- As the tracing starts, Stop Trace Session button gets enabled, clicking on which tracing will be stopped.
- Click the Clear transactions button to clear the current list and analyze new transactions.

Details of each session
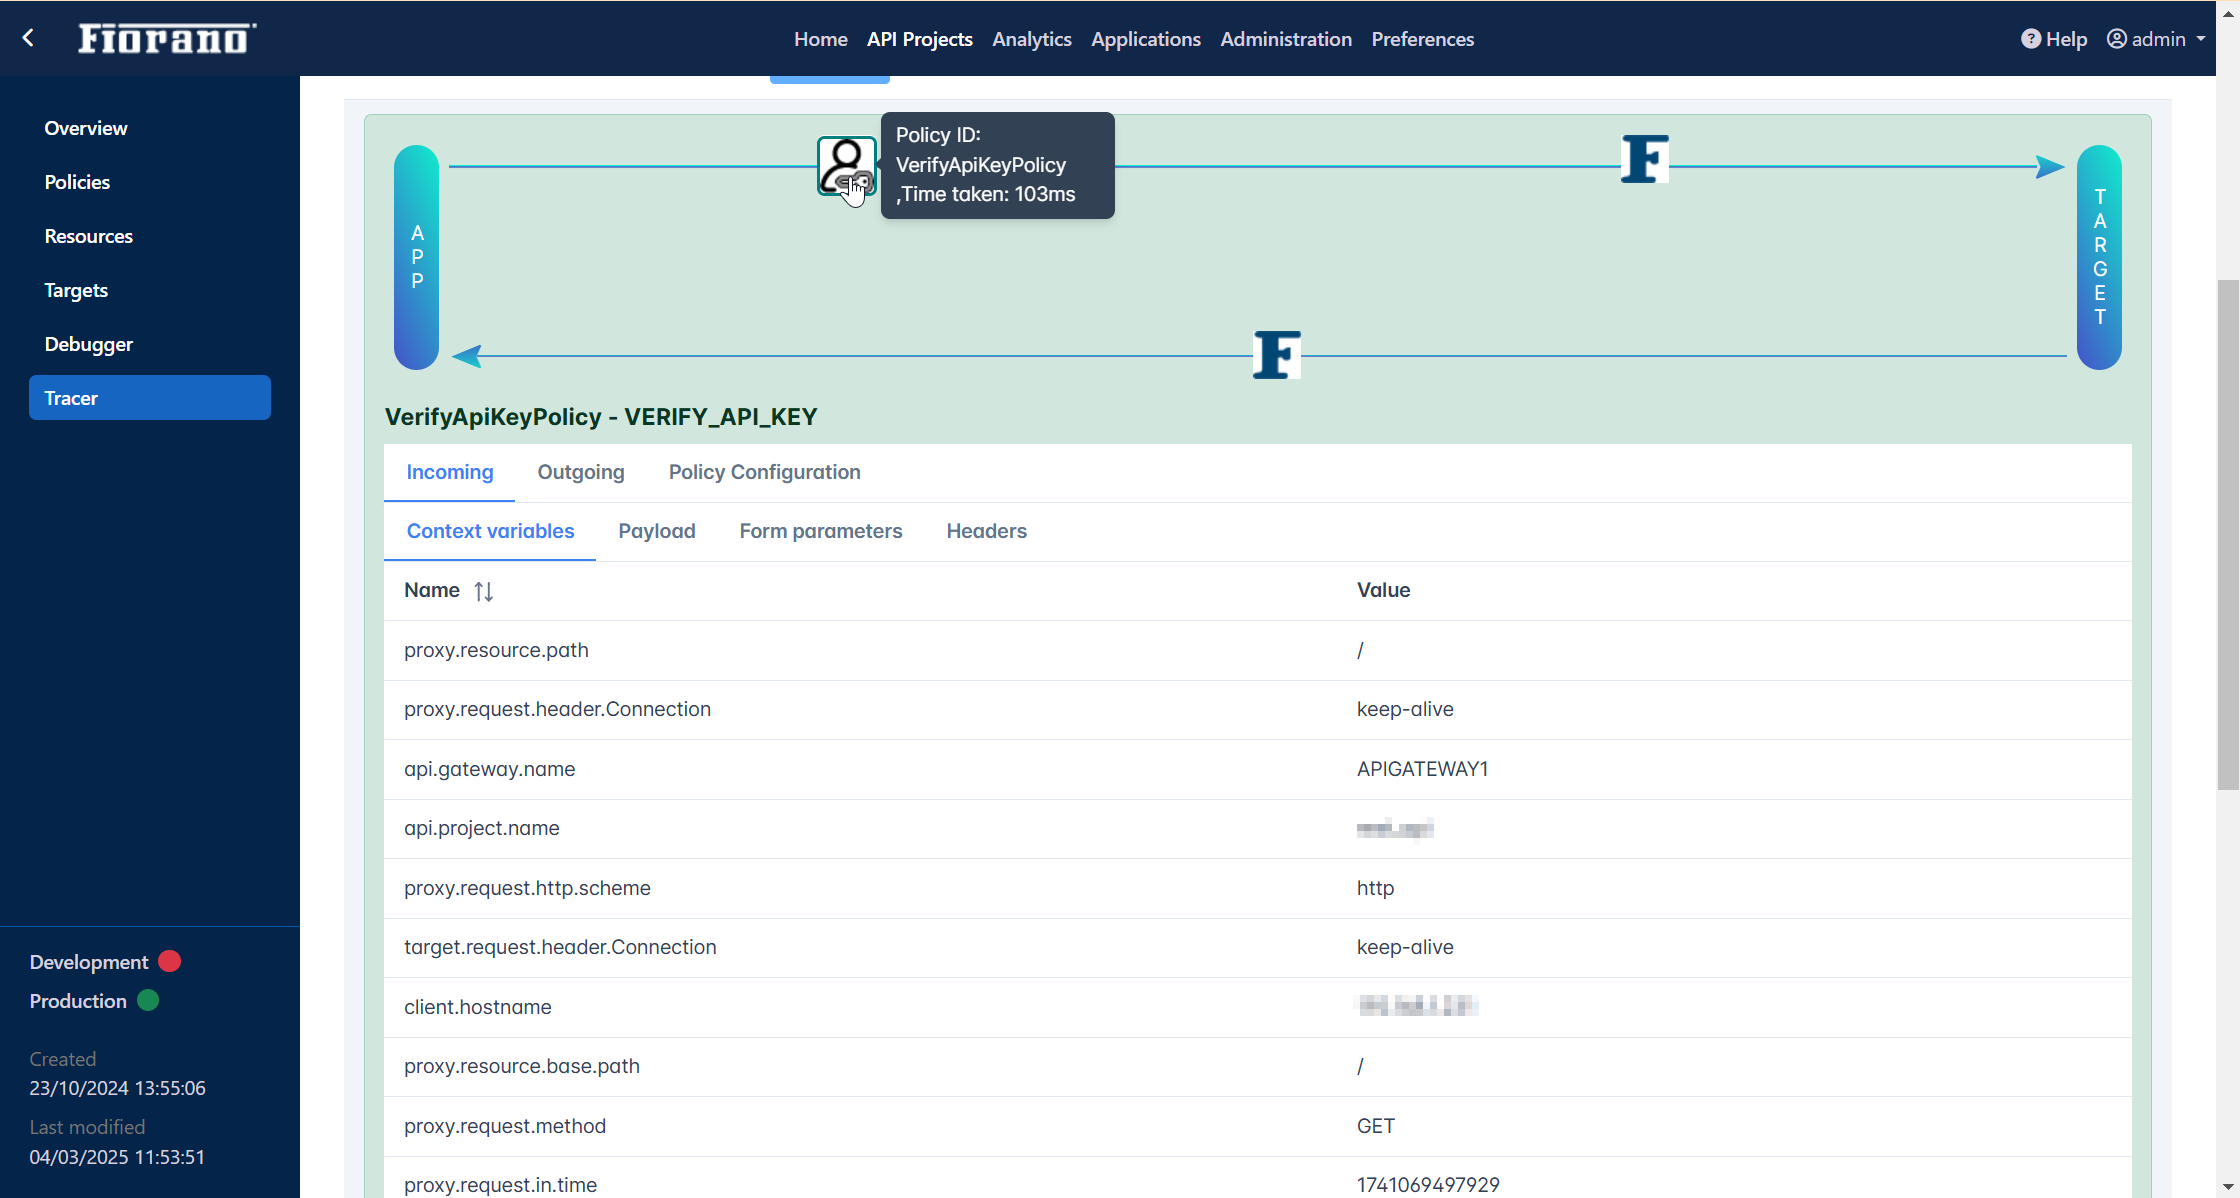
By clicking the policy icon, details of the request before executing (Incoming) the policy as well as after execution (Outgoing) will be displayed below the policies. Details such as Context Variable, Payload, Form Parameters and Headers will be displayed by clicking the respective tab.

Download Trace Session button helps download the data in JSON format to the designated Download directory.
Filtering the Transactions data
Expand the Filters tab to configure the data that needs to be filtered.
Provide the details (URI, Proxy Method, Proxy Status, Target Method, Target Status, From Date and To Date) under the Filters section based on which the transactions need to be traced and then click the Save icon.
All Sessions
All sessions help list the data for the previous sessions. Select the server group, click the All sessions button and then the View trace data button to list the data.
To download the data as a a jason file, click the Download button, select the period, page specifications and click OK.

