This section provides sections to customize language and date format, analytics settings, and life cycle stages for API projects, and enable version control.
After making changes, ensure clicking the Save icon to apply the changes made in the Preferences sections.
General settings
Language and date format in the dashboard can be changed in this section.
Changing language in the dashboard
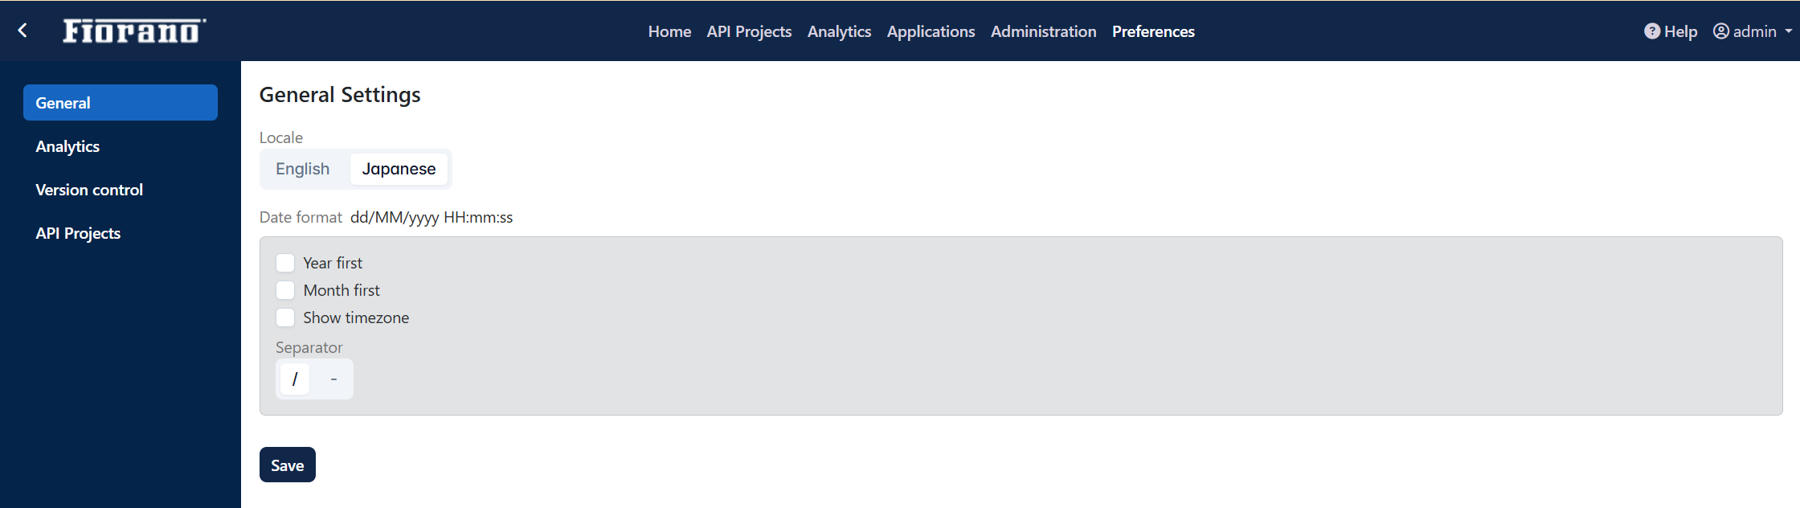
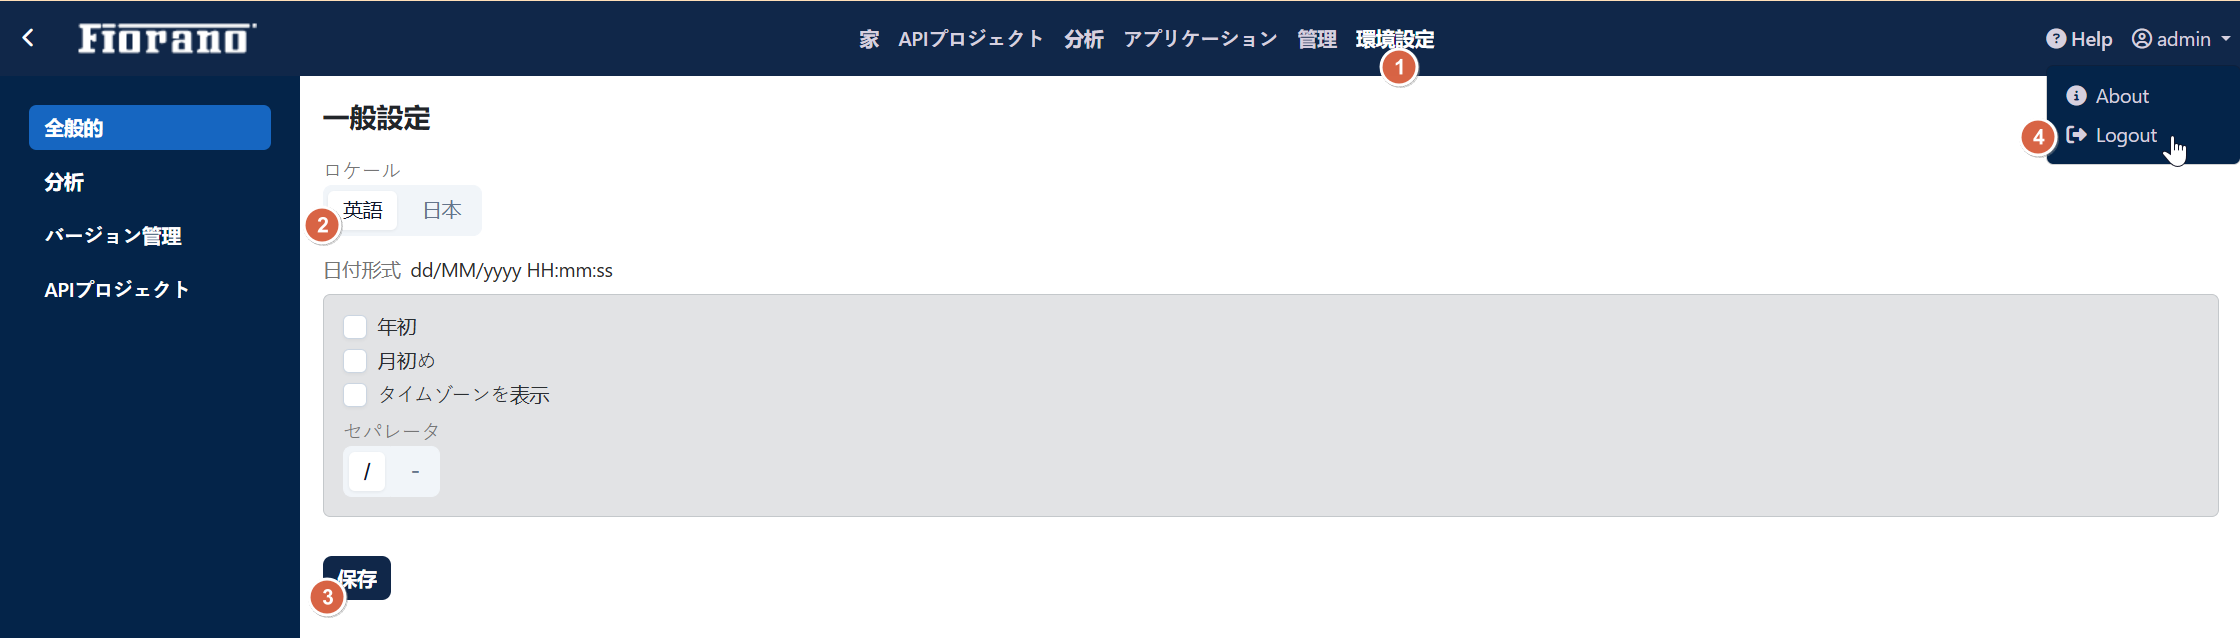
The language can be changed from English to Japanese in this section; perform the following actions to do the same:
-
Select the Japanese option and click the Save button.
-
Click the admin option and click Logout to log out of the dashboard.

-
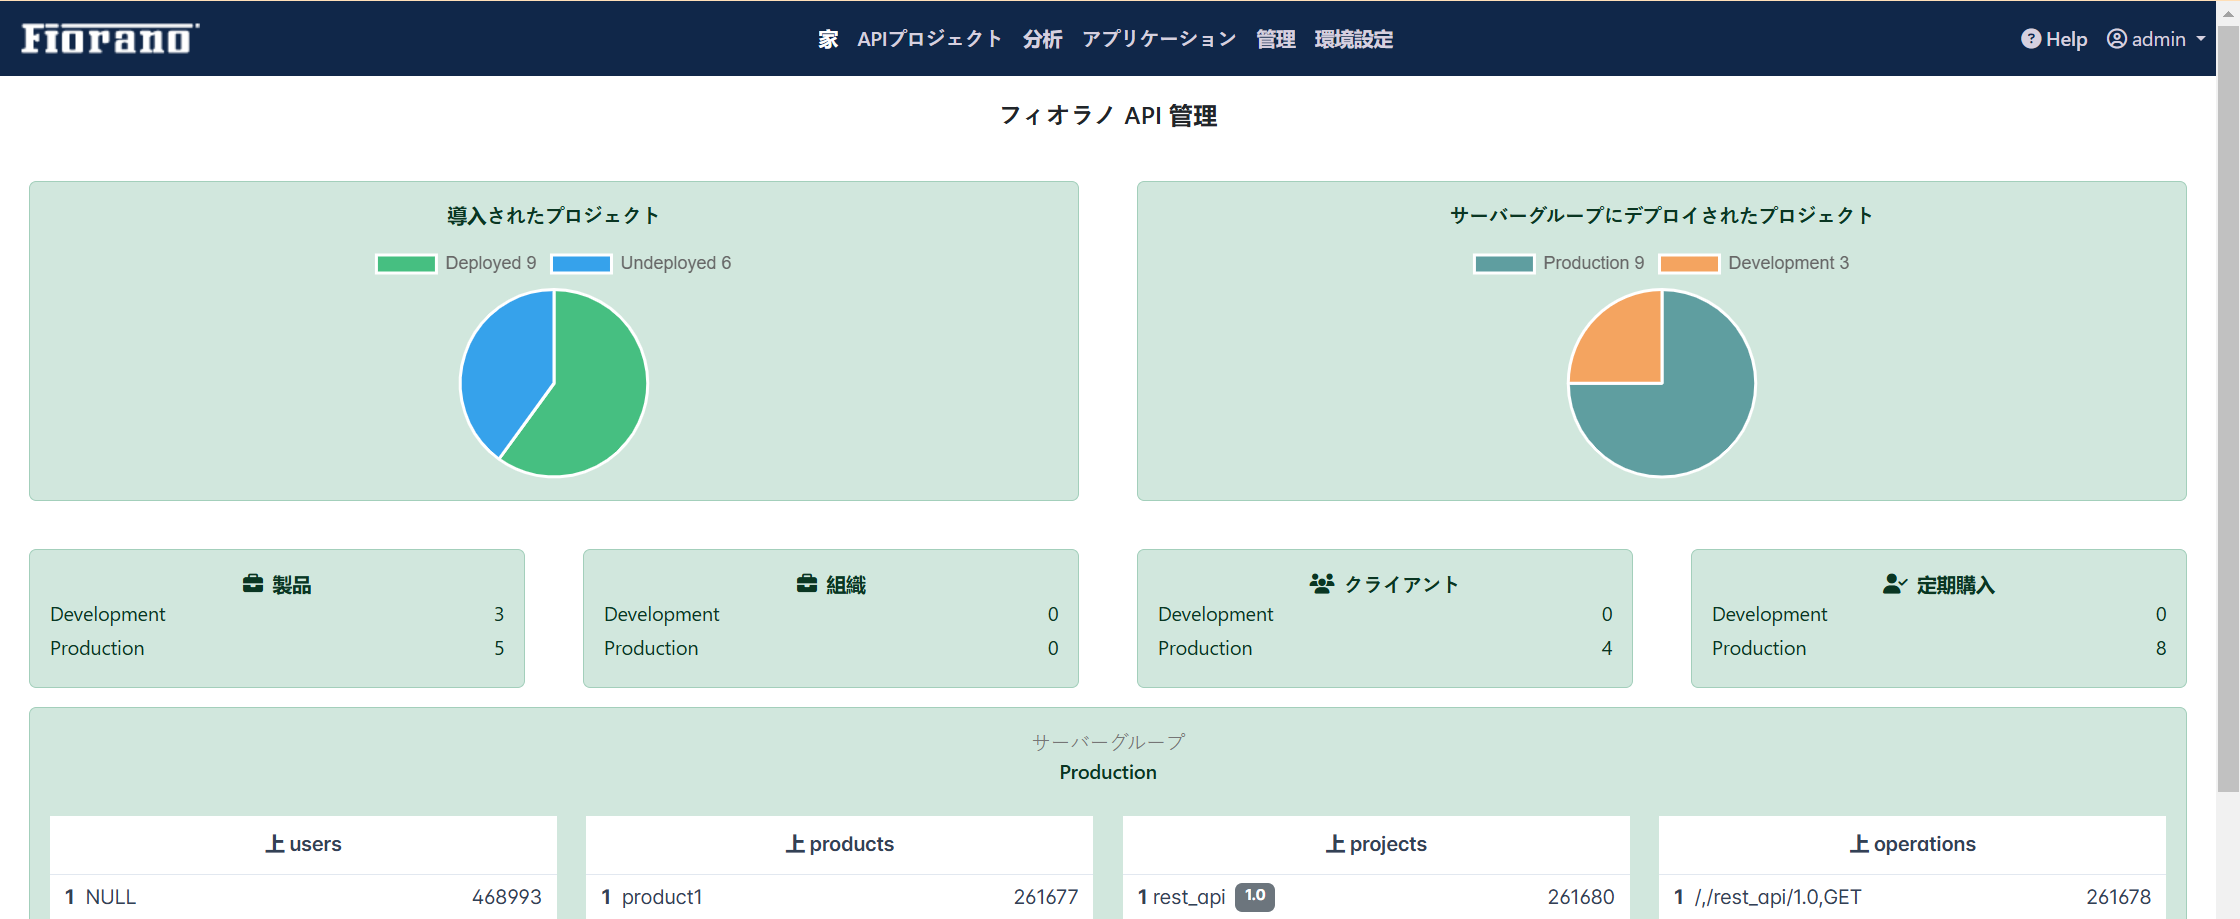
Log in back to the dashboard to see the Japanese language applied.
-
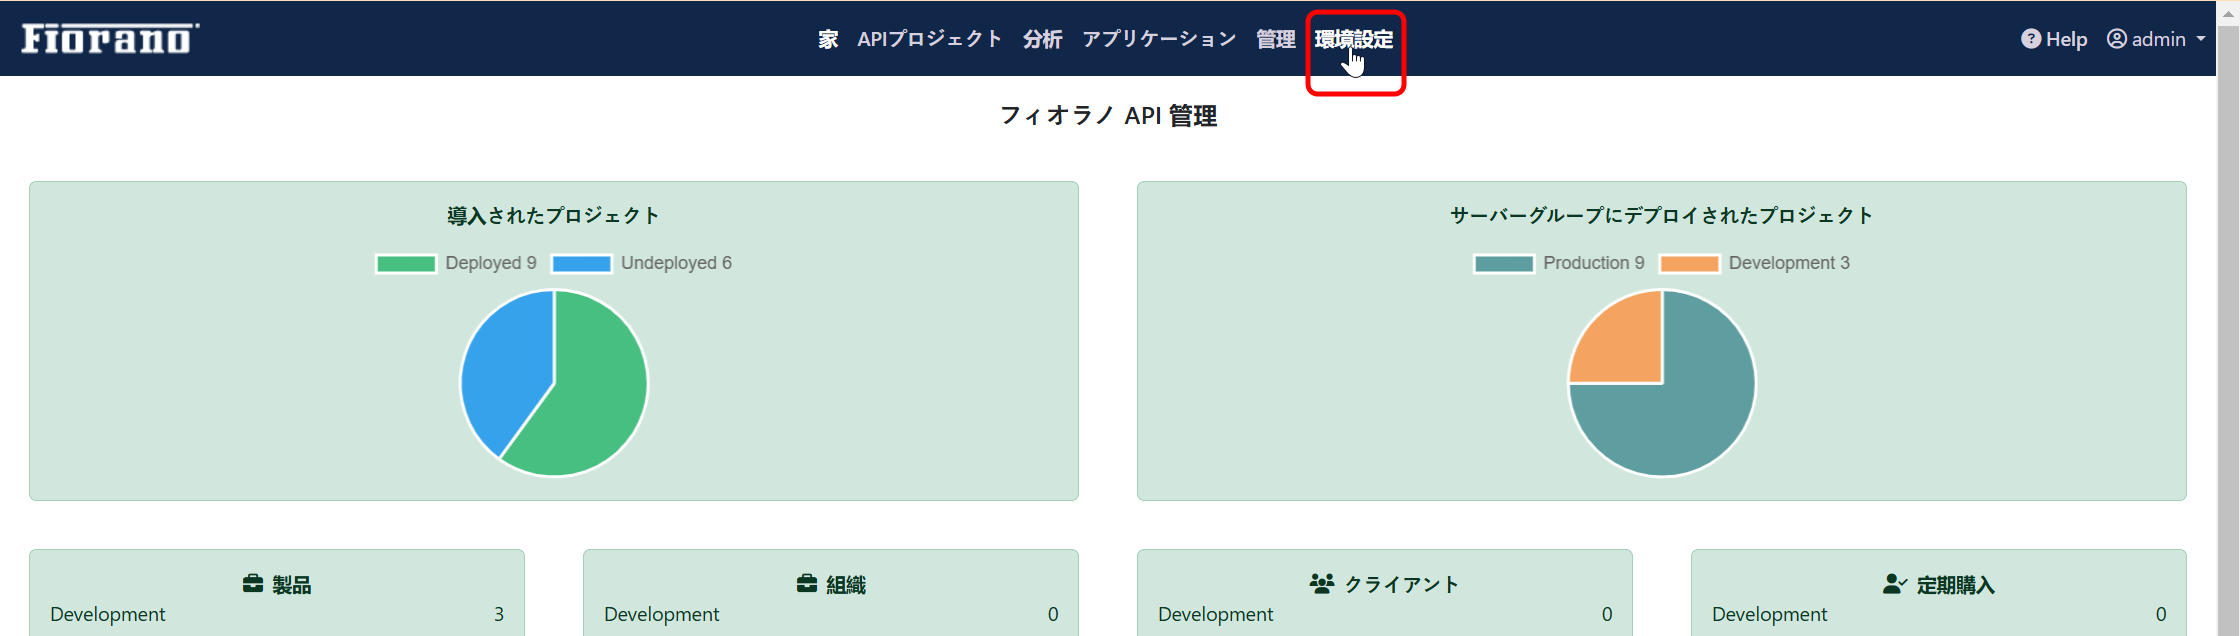
To switch back to English, click the Preferences option again and follow the same steps choosing the language as English.
Changing the date format
The date format reflects wherever the date appears through the dashboard.
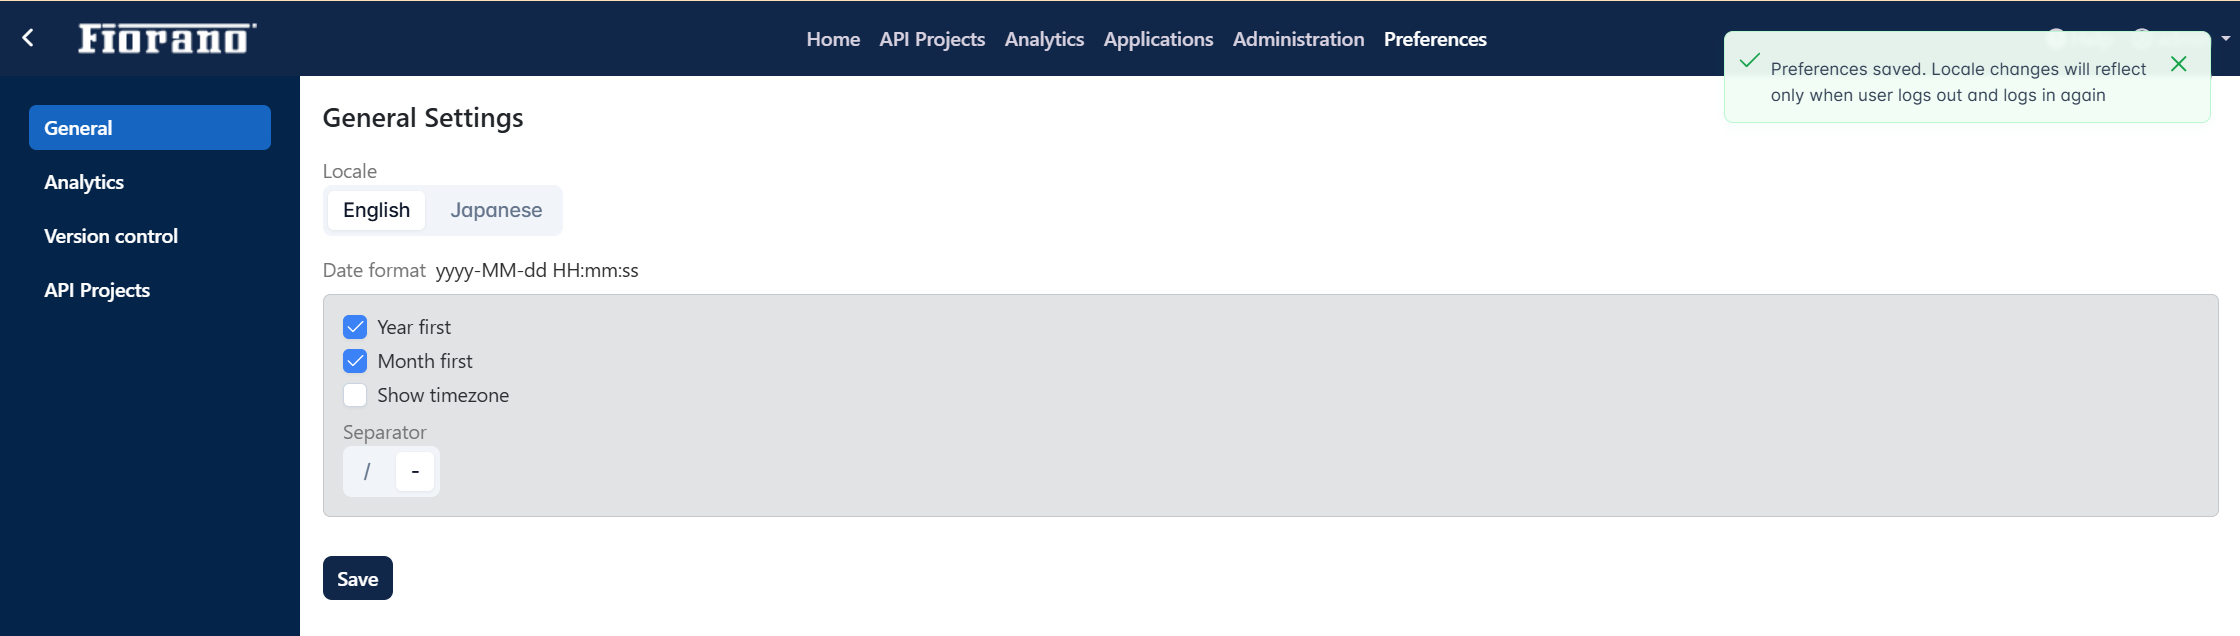
The default format is dd/MM/yyyy HH:mm:ss which can be changed to show month or year first, show timezone, and change separator from forward slash symbol to hyphen.
When the Year first option and Month first option are selected together, then the order will be year first and then month.
Make the changes, click the Save button and logout-login.
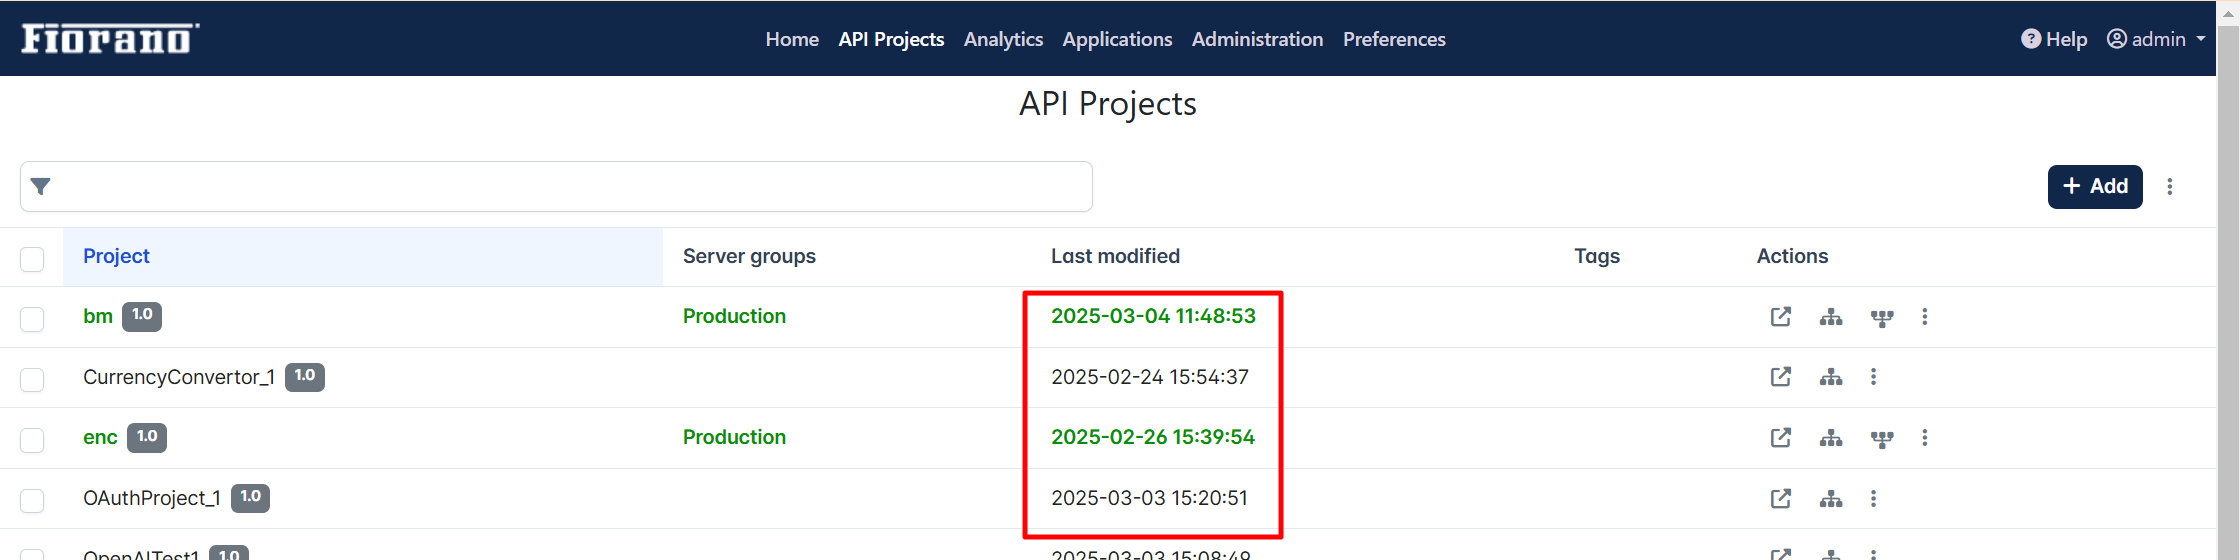
To see the changes, check the date format in the API projects page.
Analytics Settings
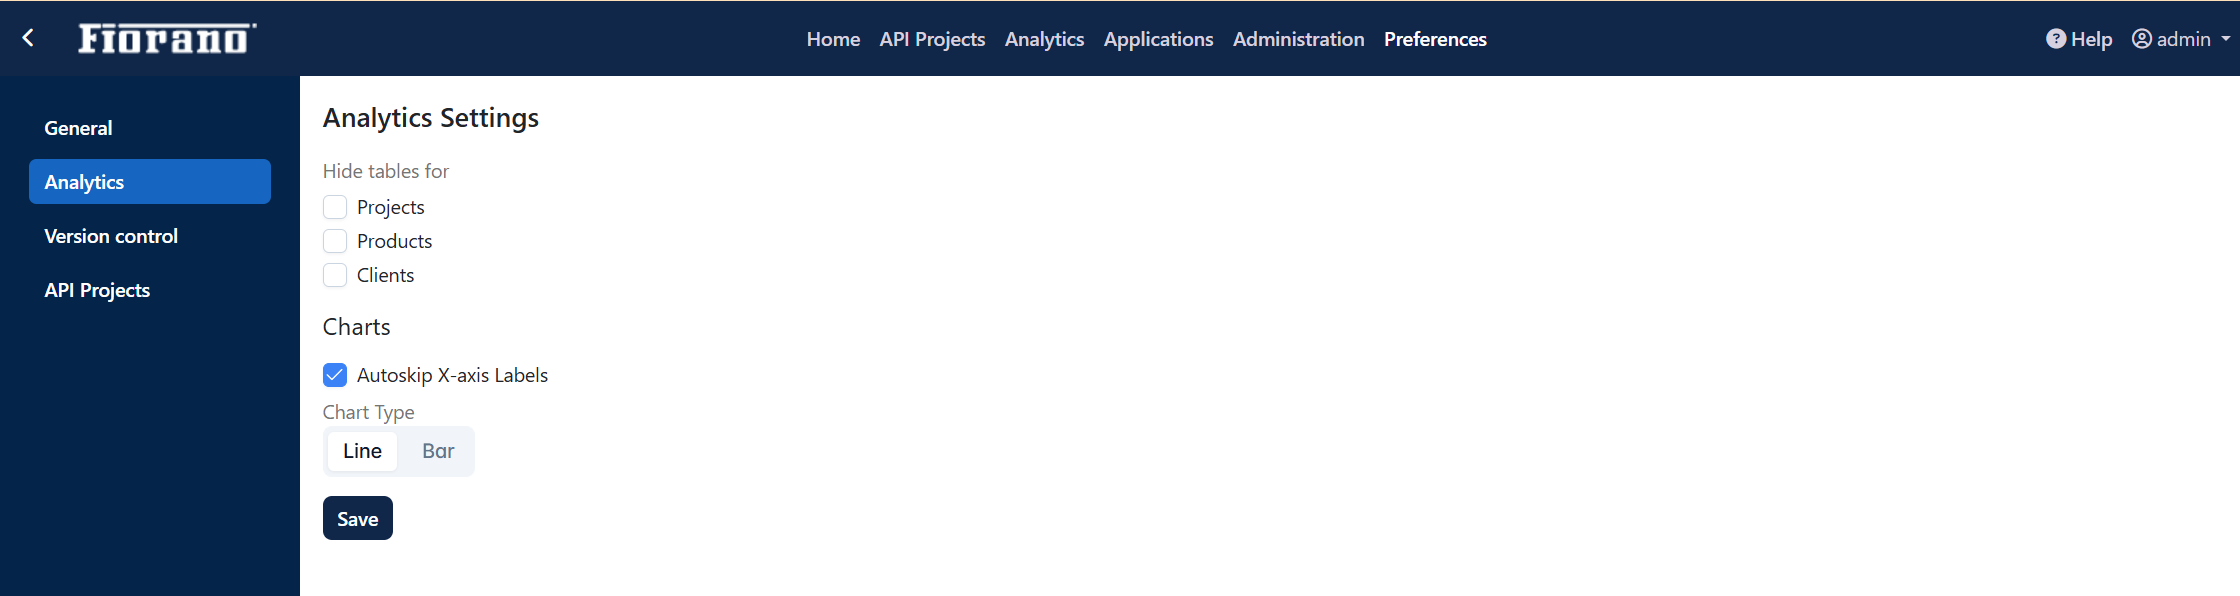
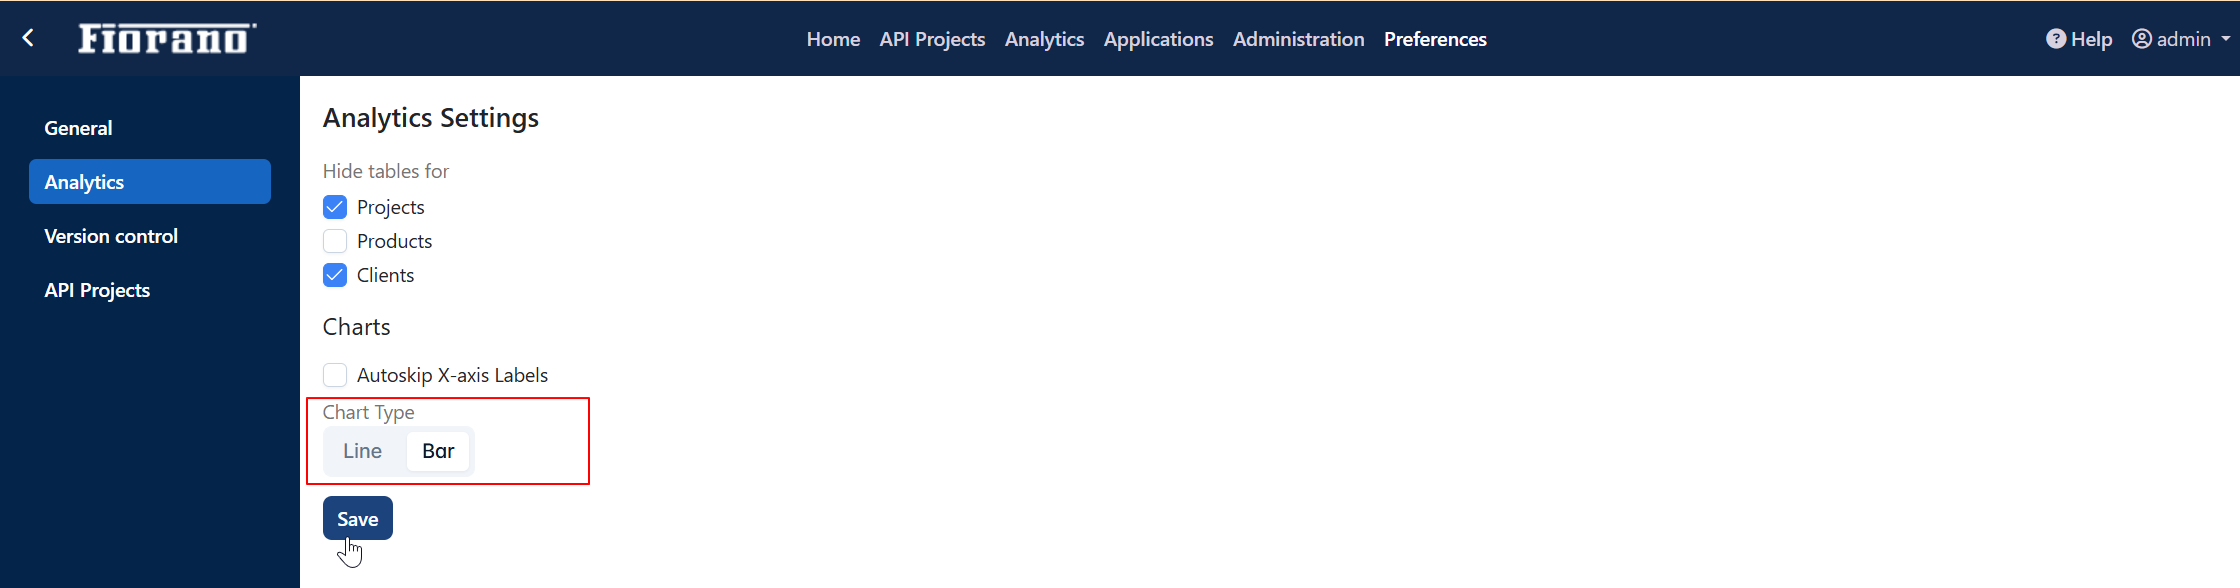
The graphical representation of reports that appear under the Analytics section can be customized from the Analytics tab under the Preferences section. The chart type can be switched between line and bar, and the tables for projects, products, and clients can be hidden from the report.
Hiding Tables
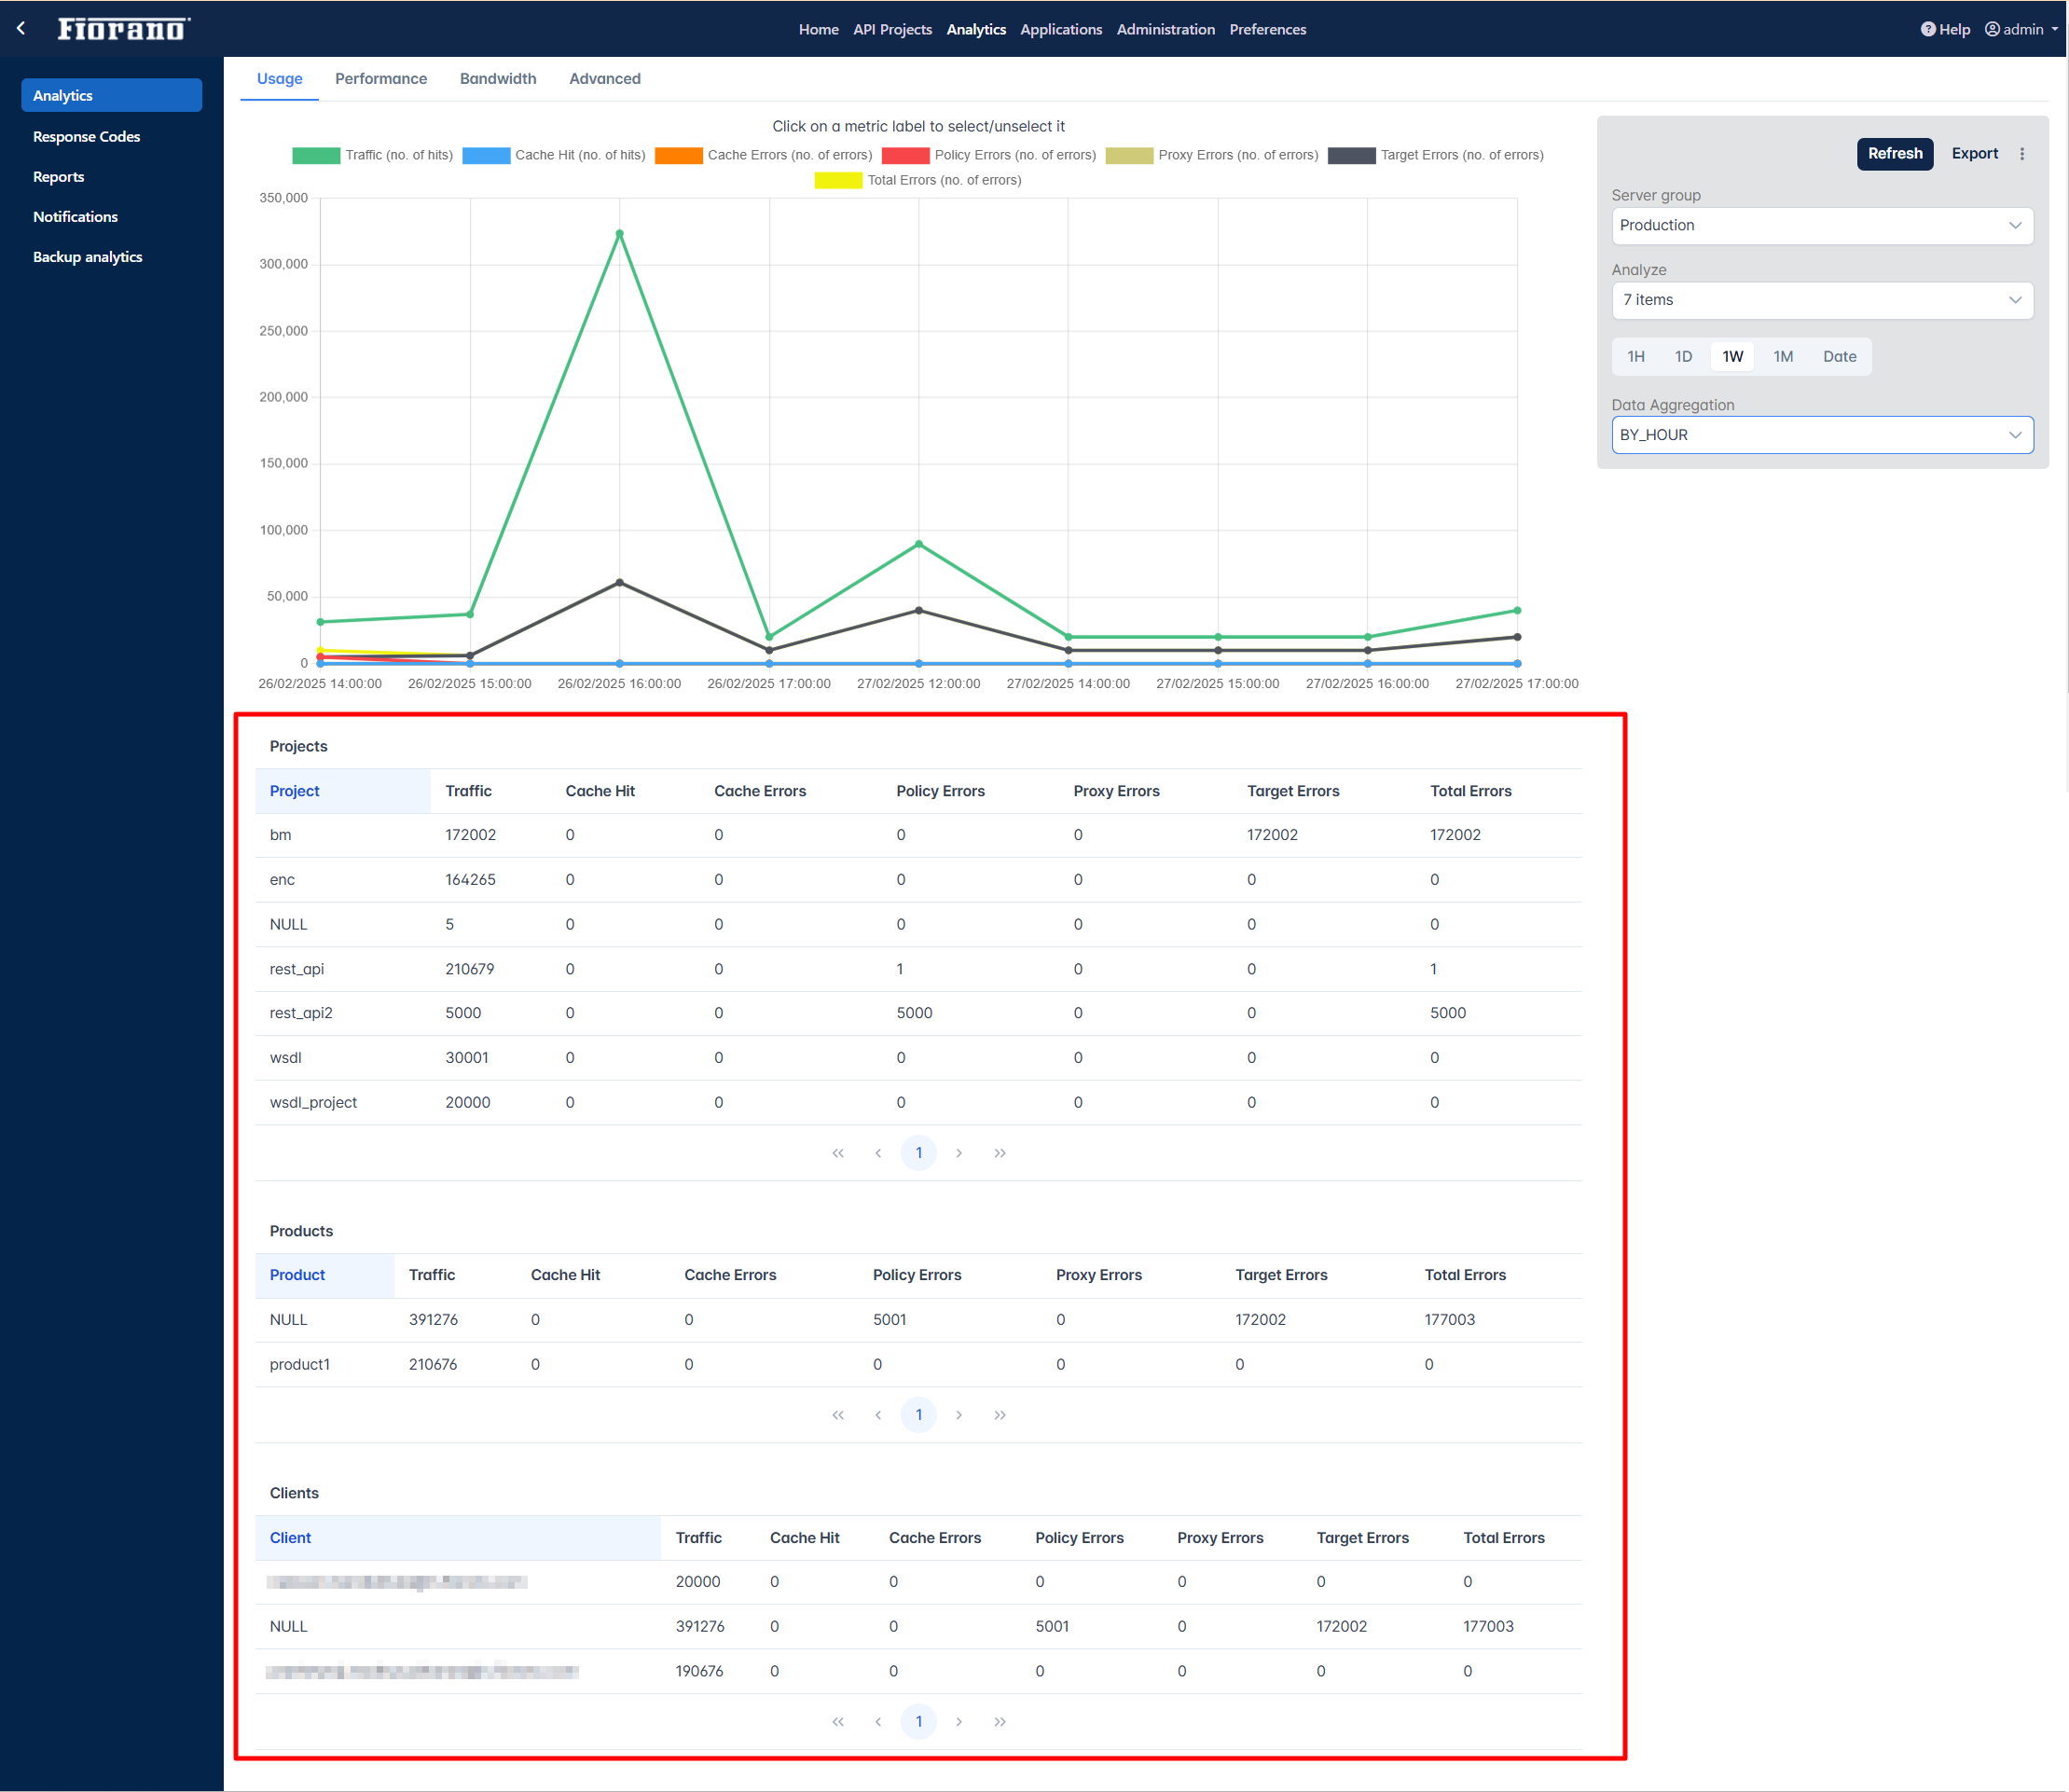
The tables below the graph in the Analytics section will have data for projects, products, and clients.
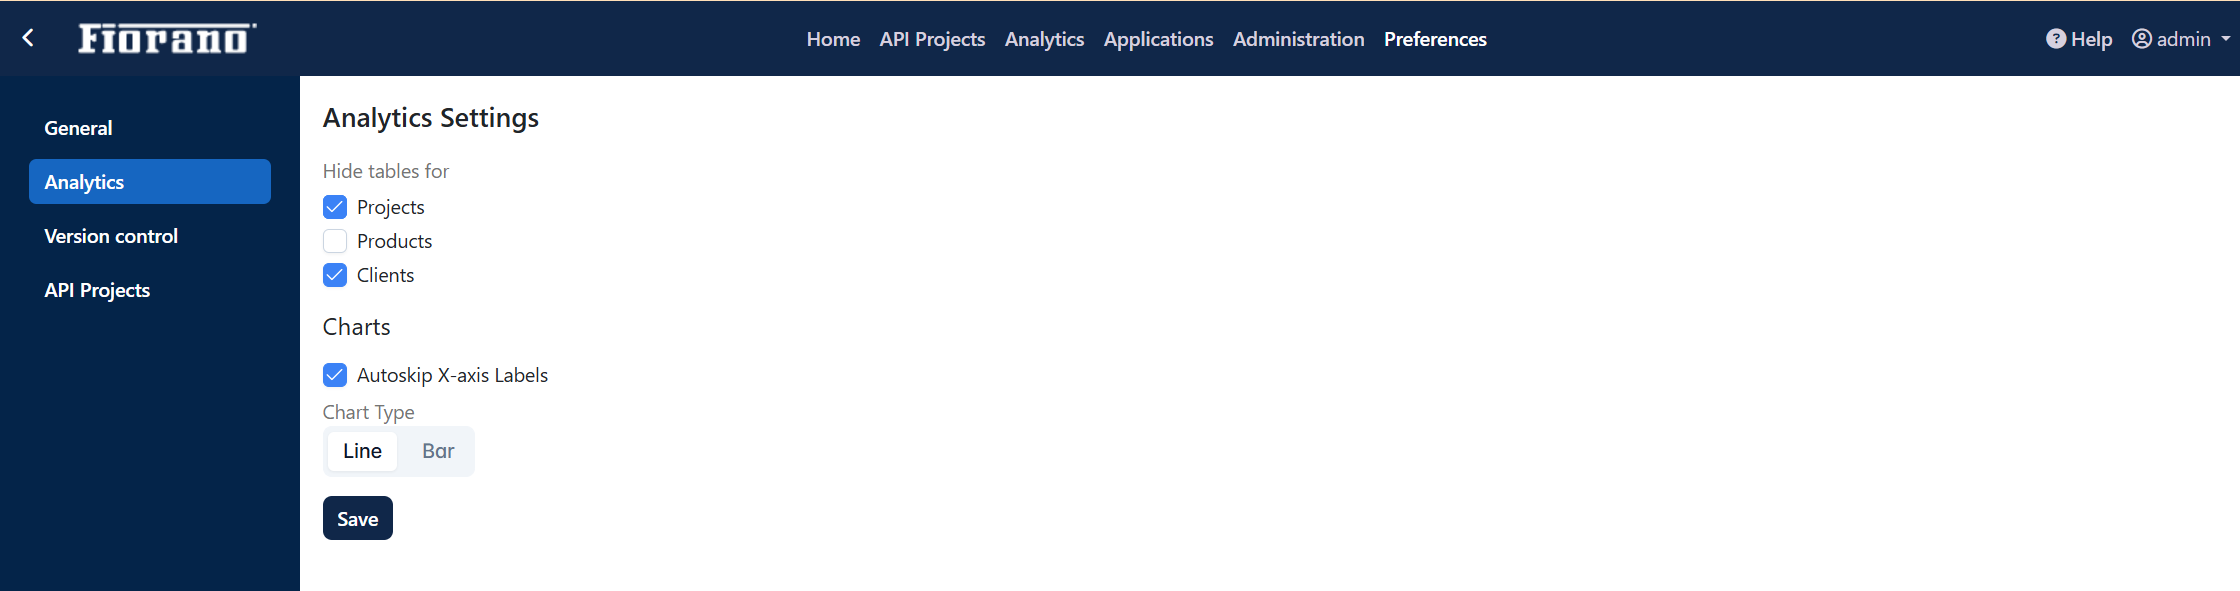
Select any or all options under the Hide tables for options as below to hide tables for the respective attribute(s) from analytics data:
-
Projects
-
Products
-
Clients
Click the Save button after selecting.
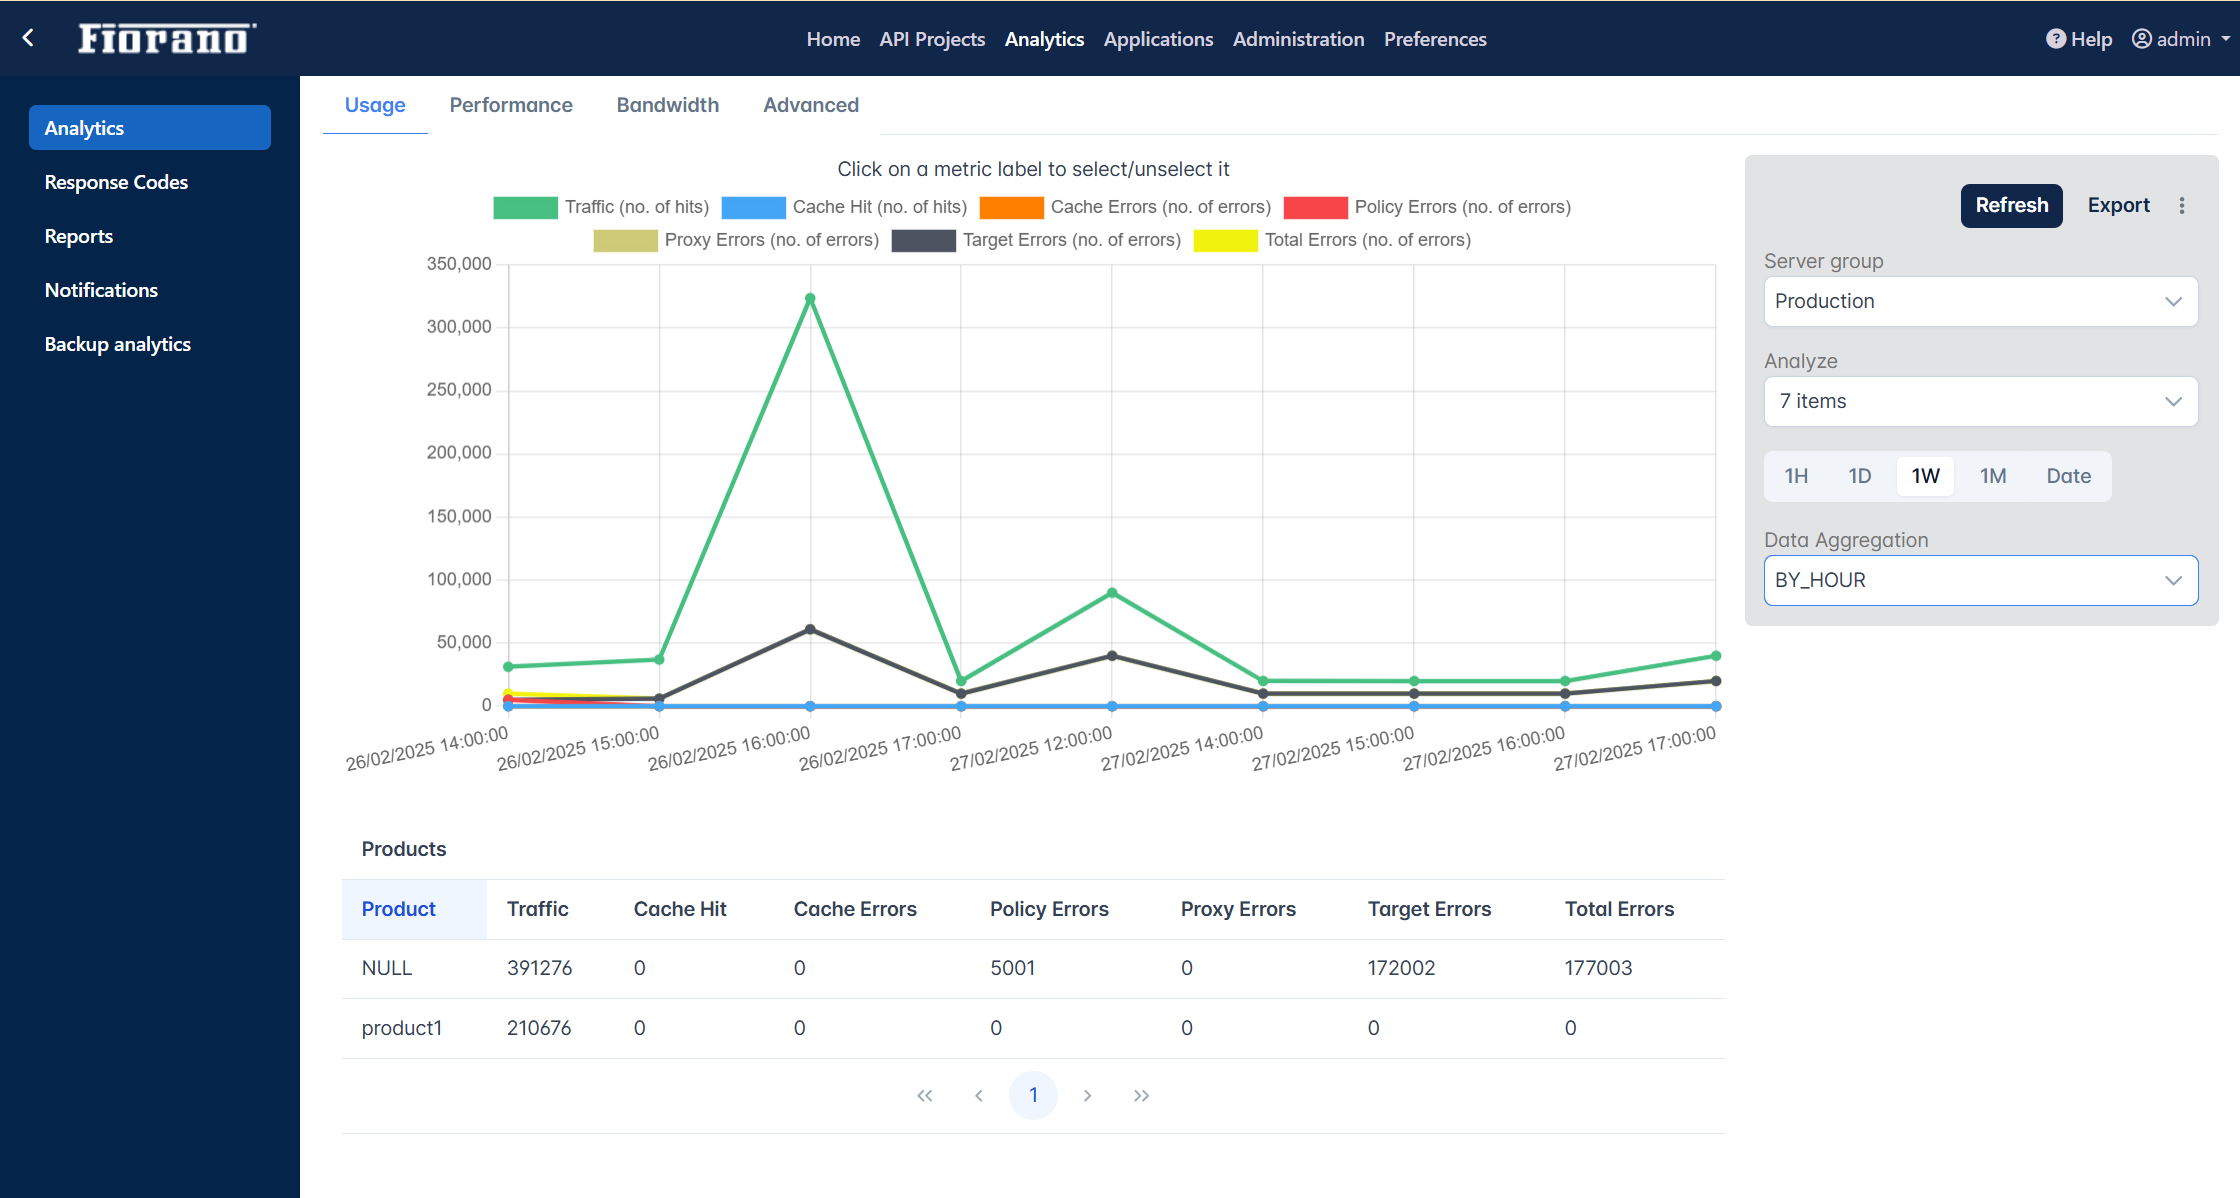
Go to Analytics section and generate a graph in the tab - Usage, Performance, Bandwidth, or Advanced where it reflects the change in table settings.
Skipping X-axis label
The Autoskip X-axis Label option will be enabled by default. Disable the option to display the X-axis label in analytical reports.
Changing the chart type
The default chart in the Analytics section is a line chart as in the figure below.
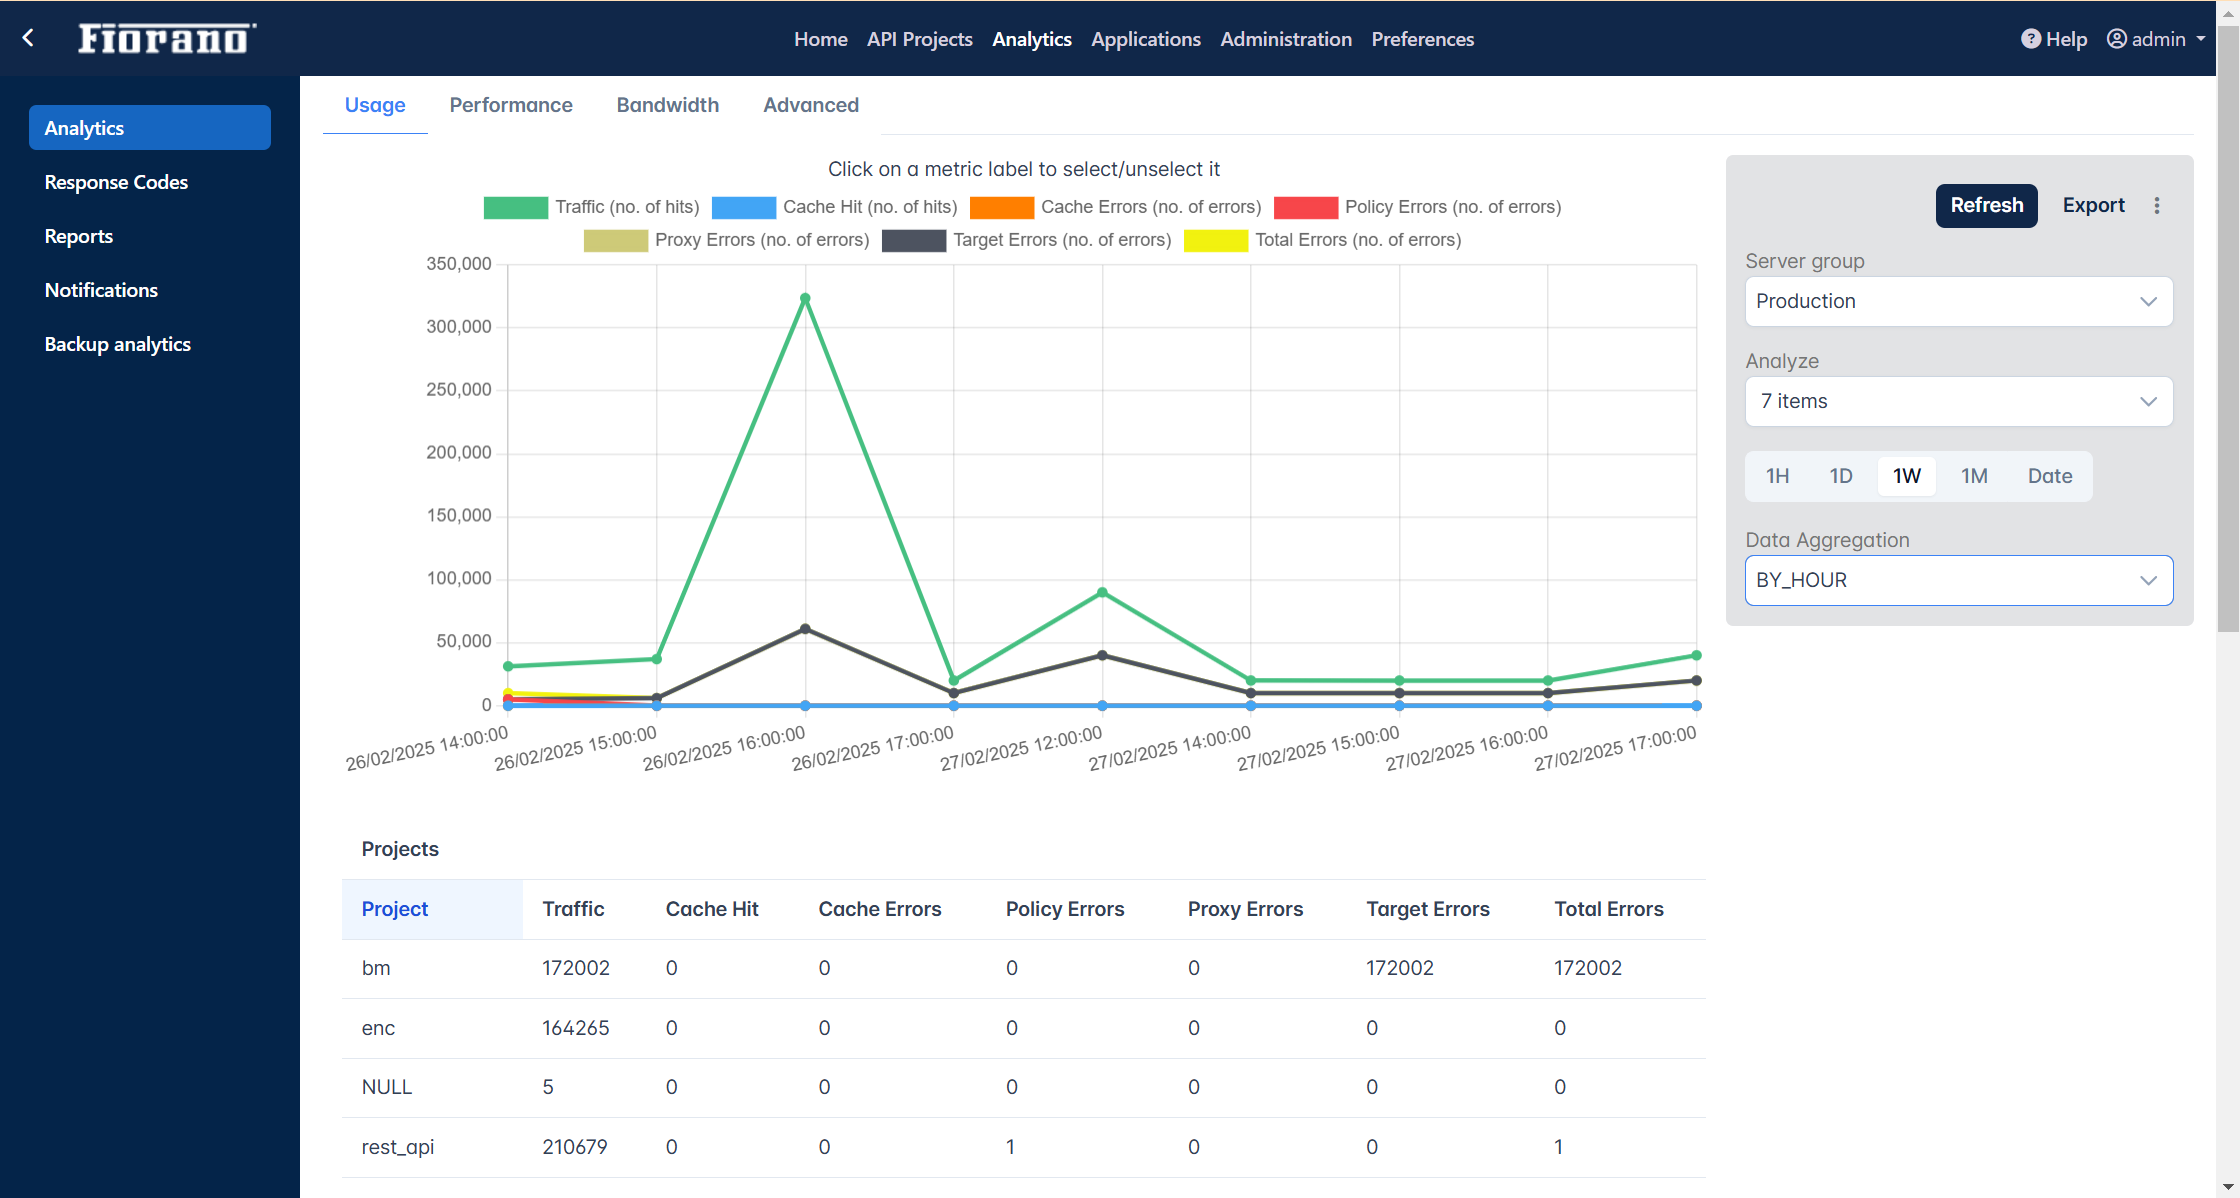
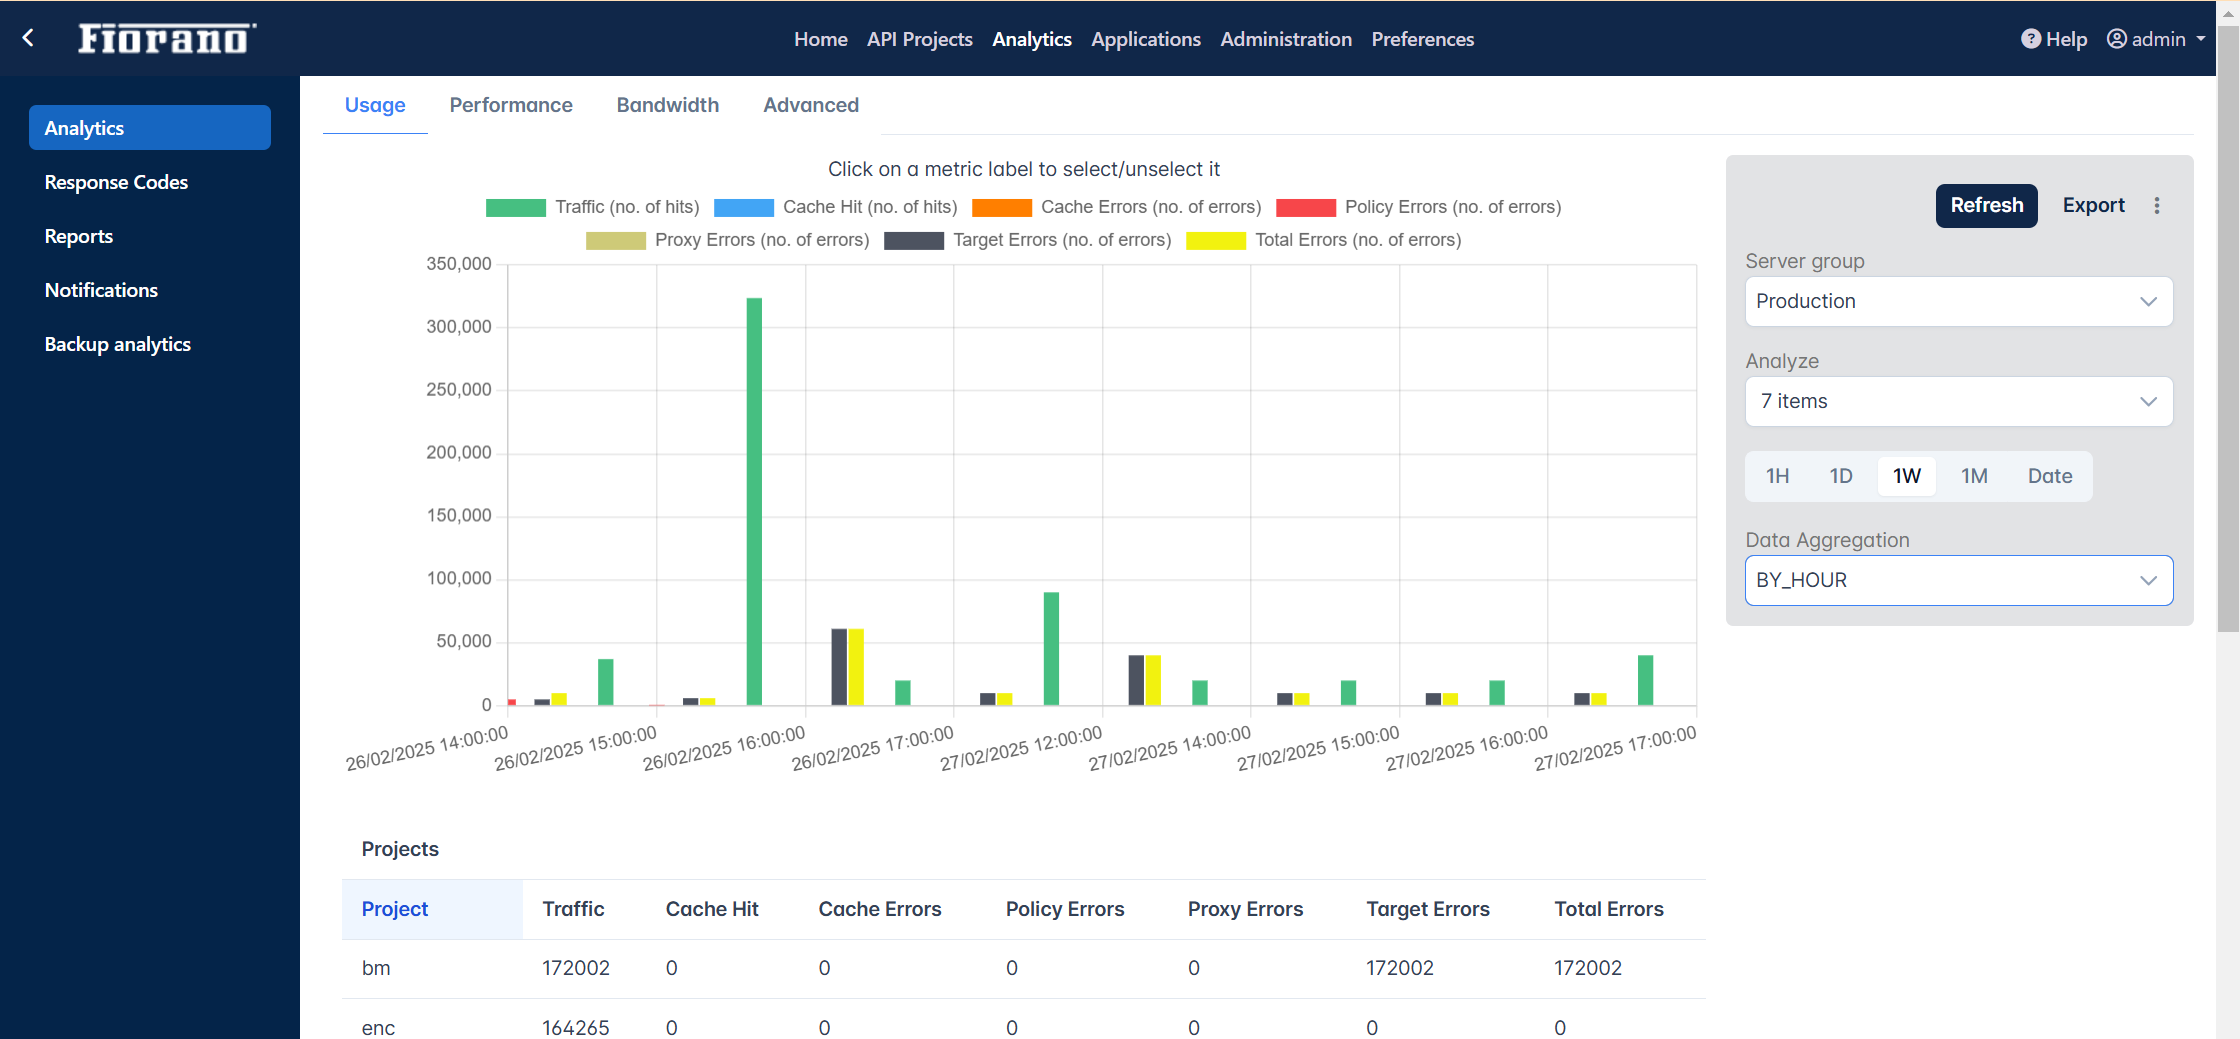
To change the chart type from the default Line graph to Bar graph, select the Bar option under Analytics settings in the Preferences section and click Save.
Check the Analytics section to see the chart type changed to bar.
Version Control
Enable version control if version management needs to be performed using GIT and set the configuration by adding the related values.
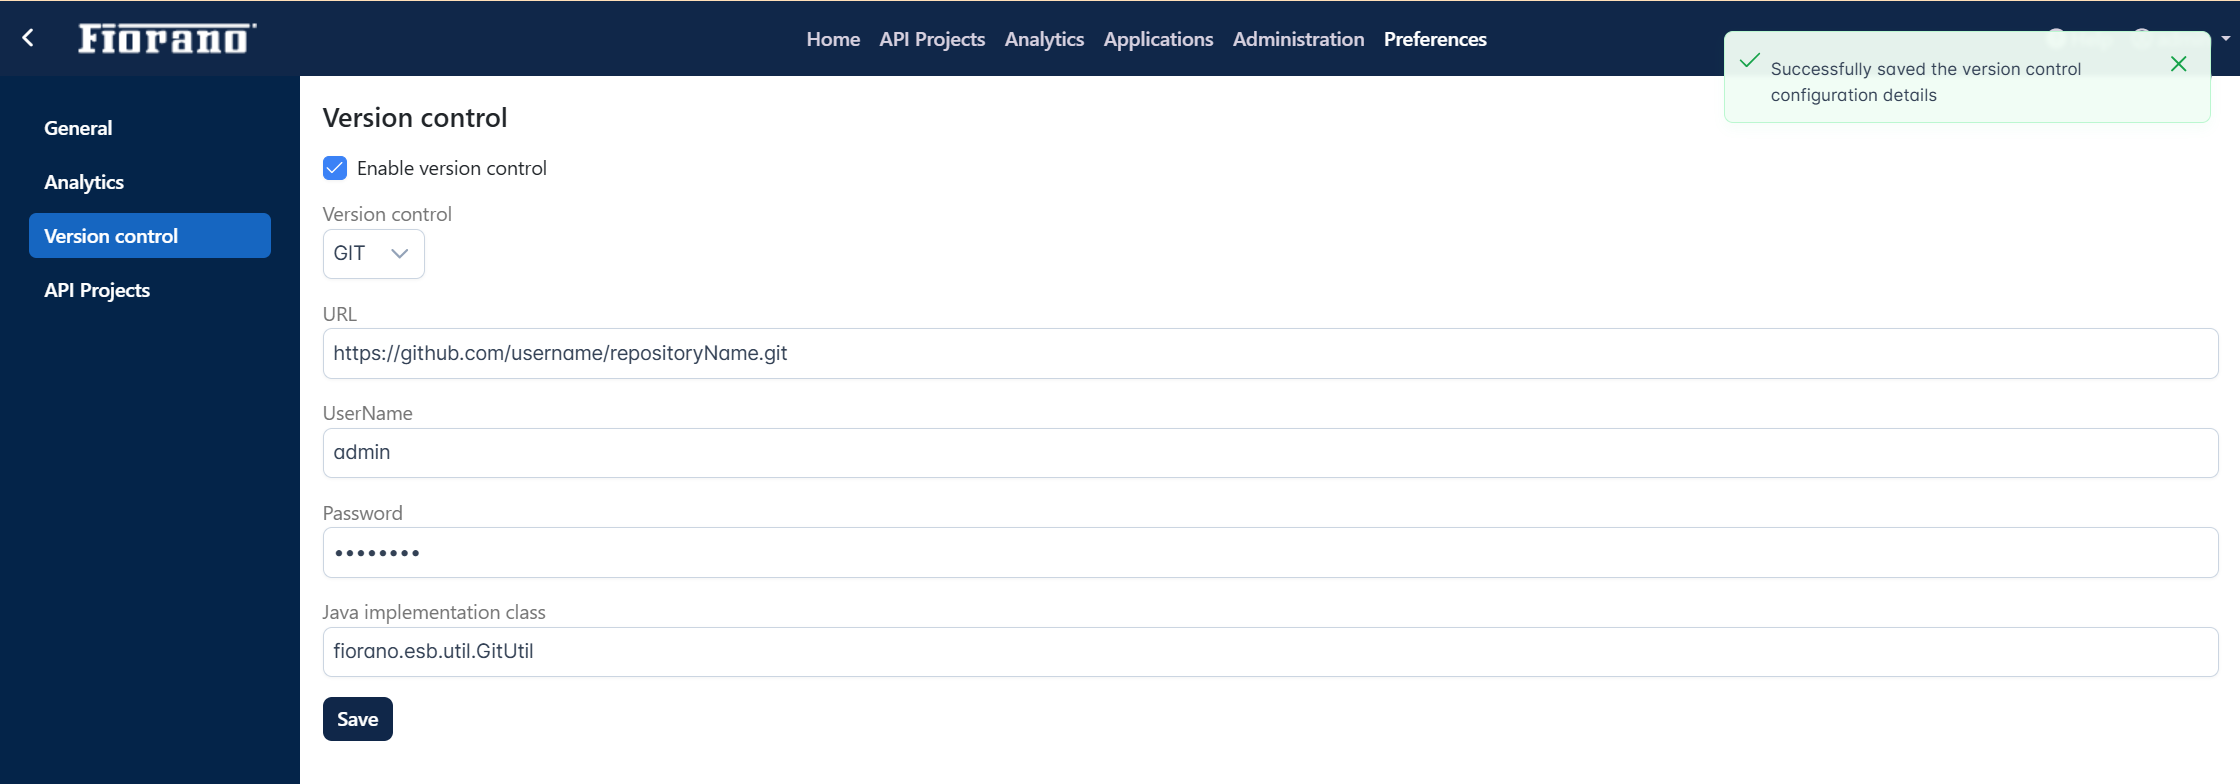
Refer to the Version Control section to see the version control options.
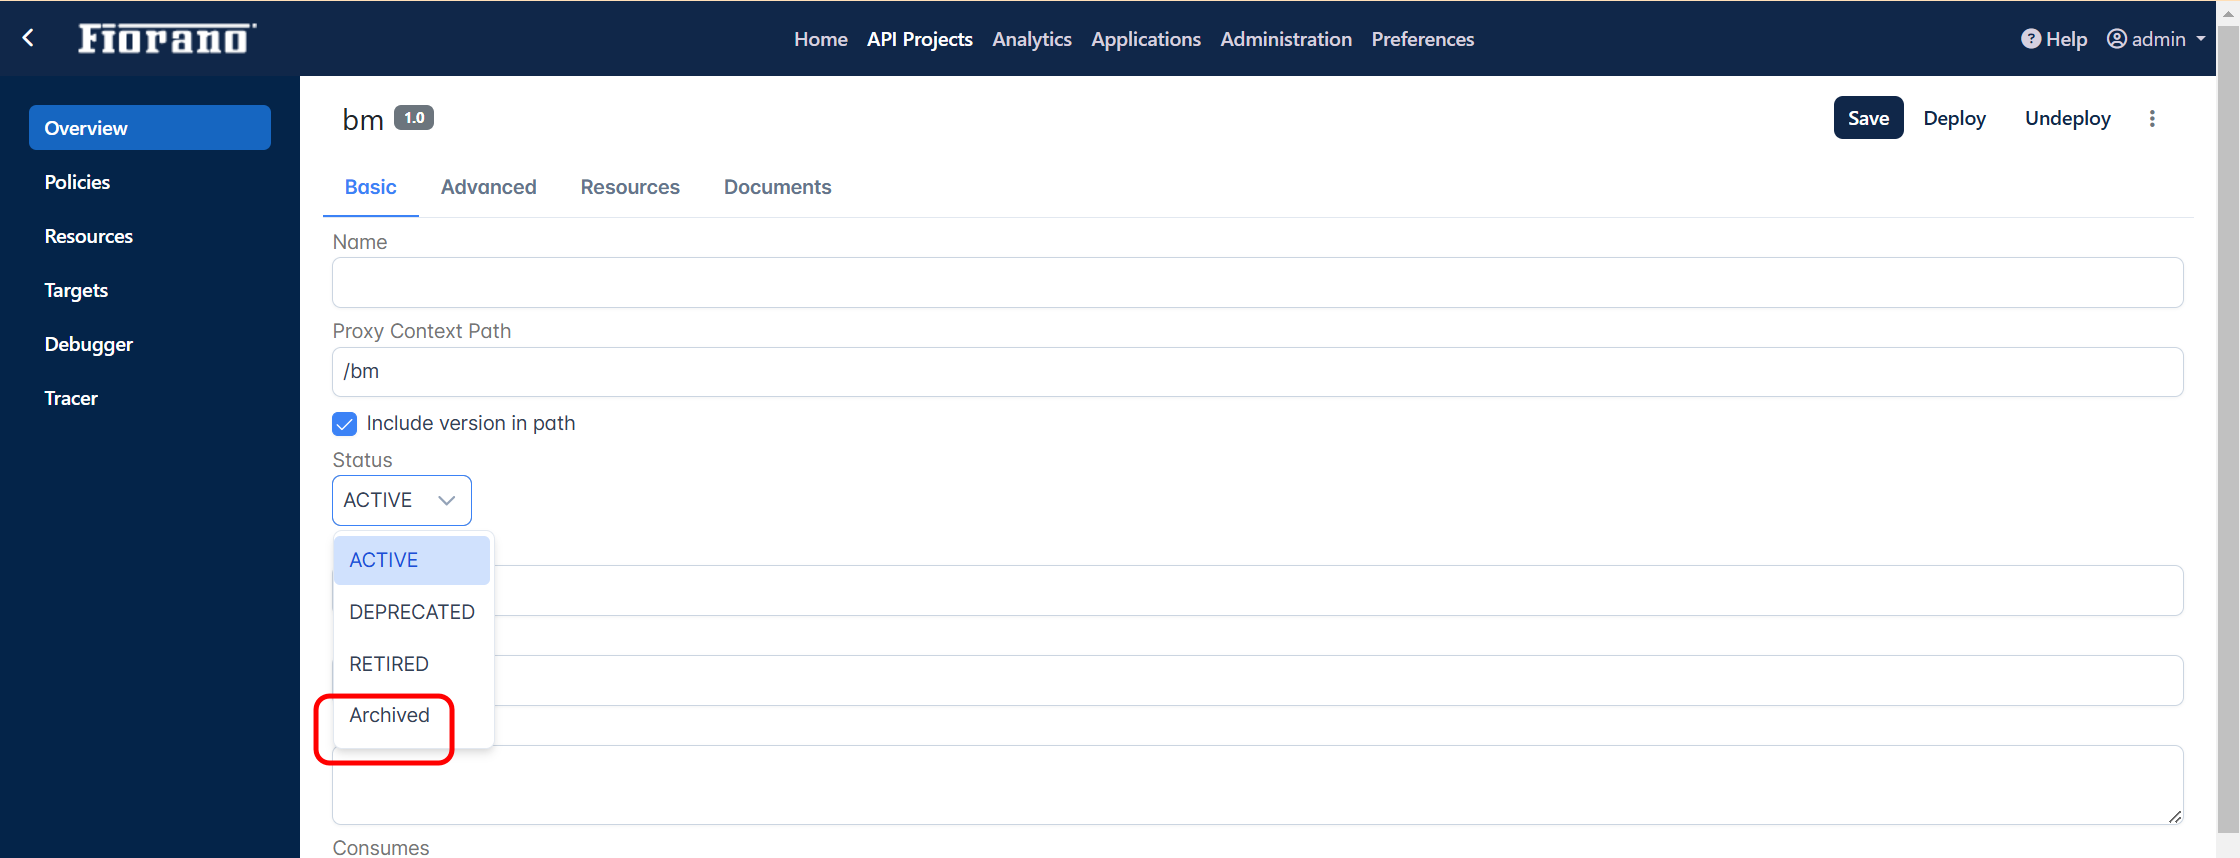
Adding a new life project cycle stage
This section helps to add and remove custom life cycle names for API projects. To add, type the name and click the Save button.

To remove the added stage name, click the cross mark next to the name.
The default stages - Active, Deprecated, and Retired cannot be removed.
The new life cycle can be used from the Status drop-down in the API Projects > Overview tab.