
Server Status page
-
displays the system details of the Management Servers and Gateway Servers
-
provides a graphical view of the CPU utilization and memory usage statistics
-
enables stopping and restarting of a running Active/Passive server
Click the Server Status icon in the Administration section to open the page in the Administration section with the Server Details displayed on the right side of the screen.
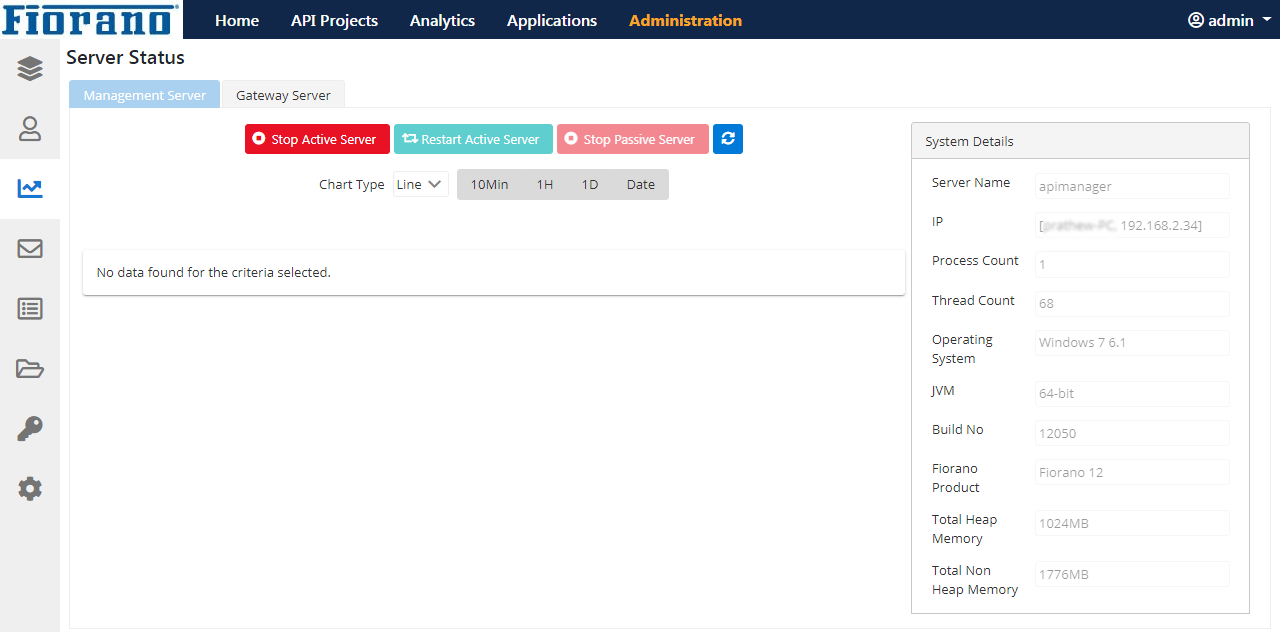
Figure 1: Server Status page in the Administration section
Analyzing CPU and Memory Utilisation using Graphs
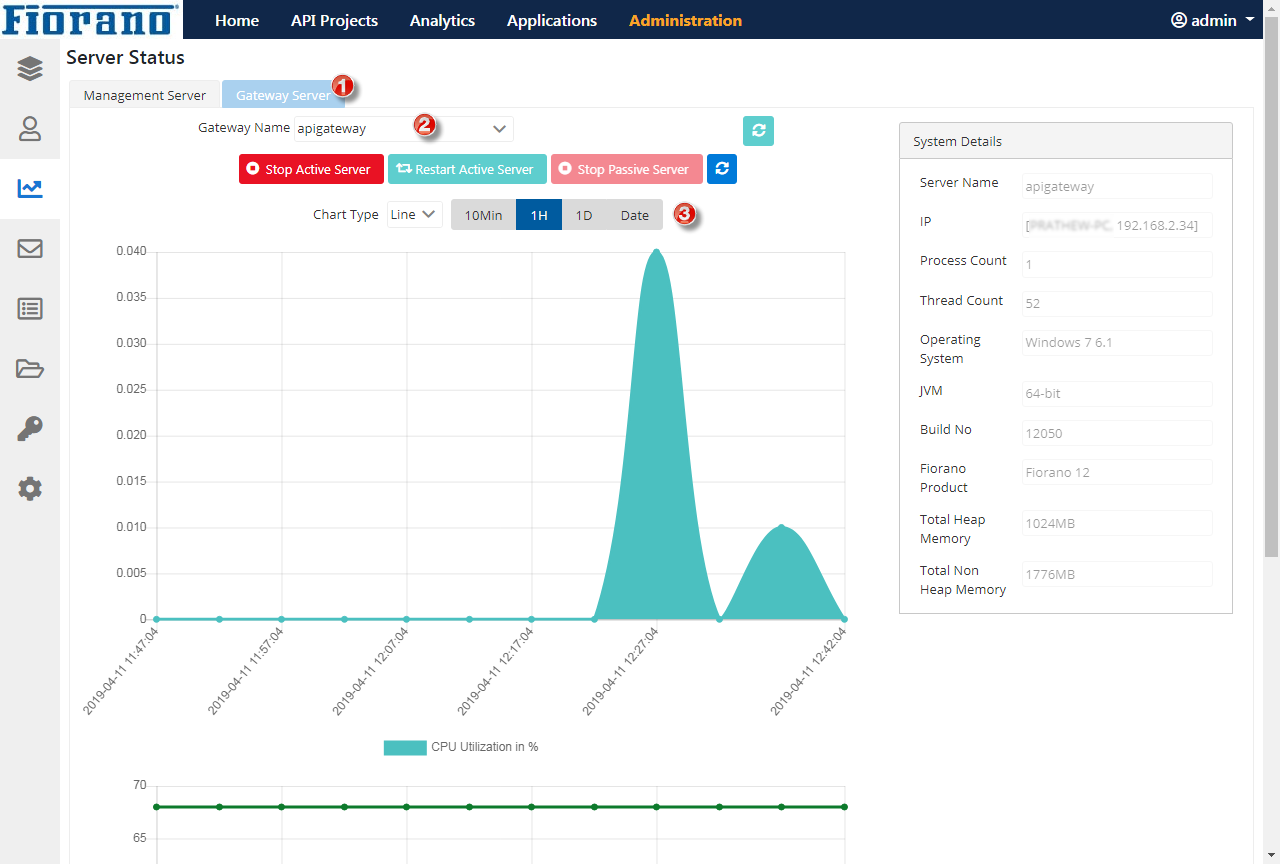
Select the Time Interval and Graph Type to generate graphs for the respective period after clicking the Management Server or Gateway Server tab (select the server name also for Gateway server).
-
Refresh icon near the Stop Passive Server button refreshes the graph.
-
Refresh icon near the Gateway Name drop-down clears the graph altogether.
Time Interval
To analyze CPU utilization and memory, select the given set of time intervals to see the performance during that time. Select the Time Interval from the following options:
-
10 min (minute)
-
1 H (hour)
-
1 D (day)
-
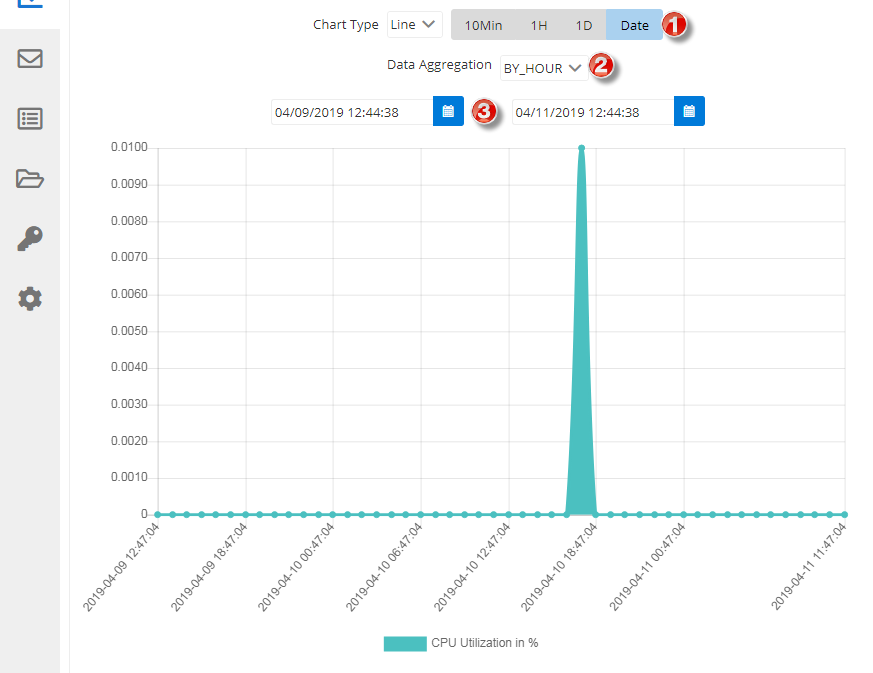
Date
Set the start and end timing and choose the Data Aggression option from the below:
-
By DayThis option is available only if the time interval is above 1 day. This will be the only option available after 3 days interval.
-
By HourThis option is available only if the time interval is 1-2 days.
-
By MinuteThis option is available only if the time interval is 1 day.
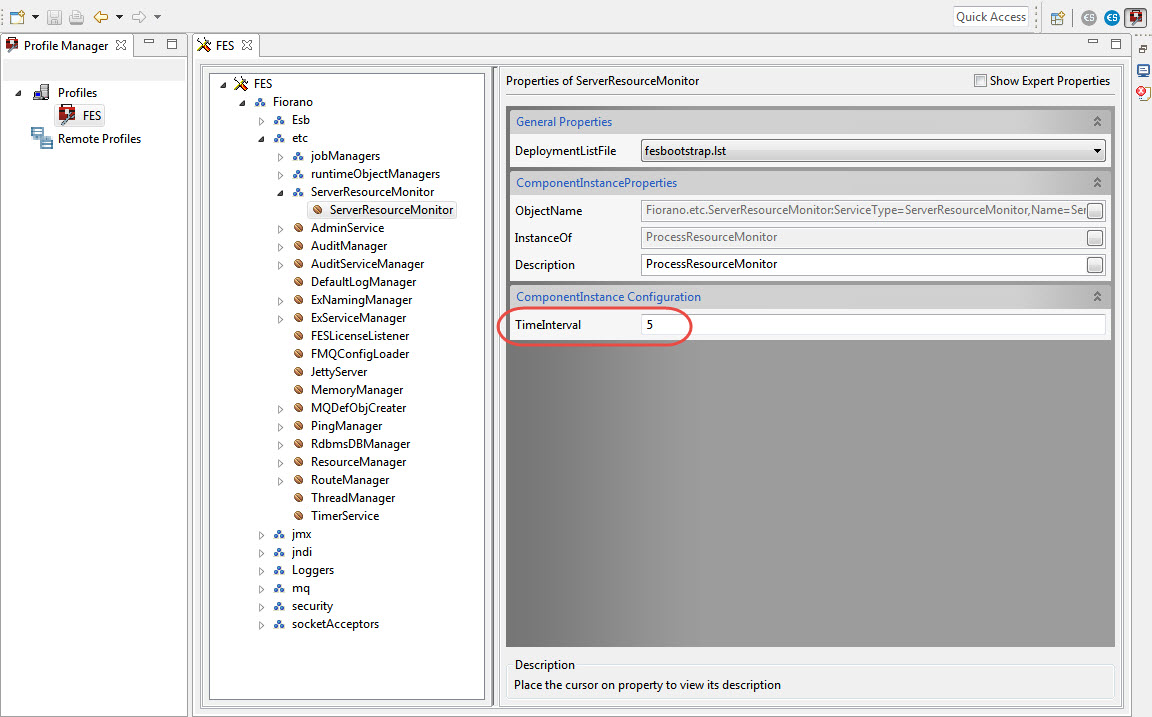
The default time interval for logging server memory details is 5 minutes. This can be changed in eStudio Profile Management Fiorano > etc > ServerResourceMonitor.
Graph Type
Choose the Graph Type from the below options (the sample graphs are generated with 1 Hour criteria):
-
Line

CPU Utilization Graph
Memory Usage Graph
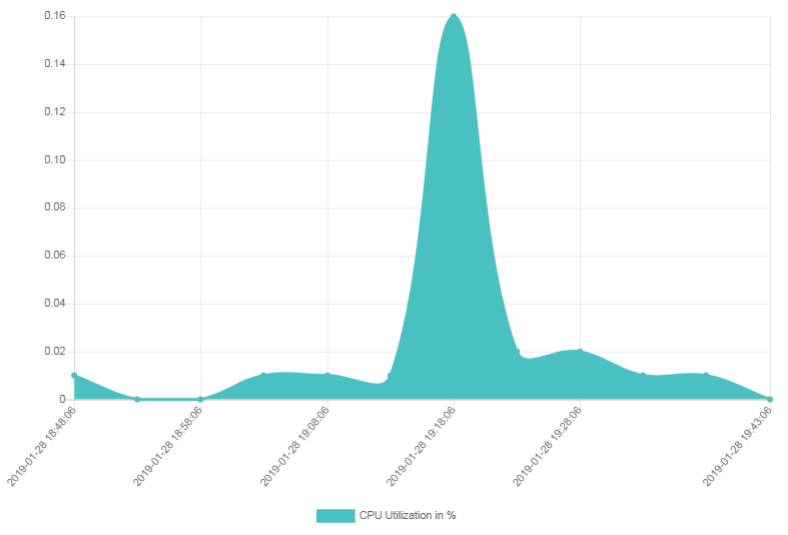
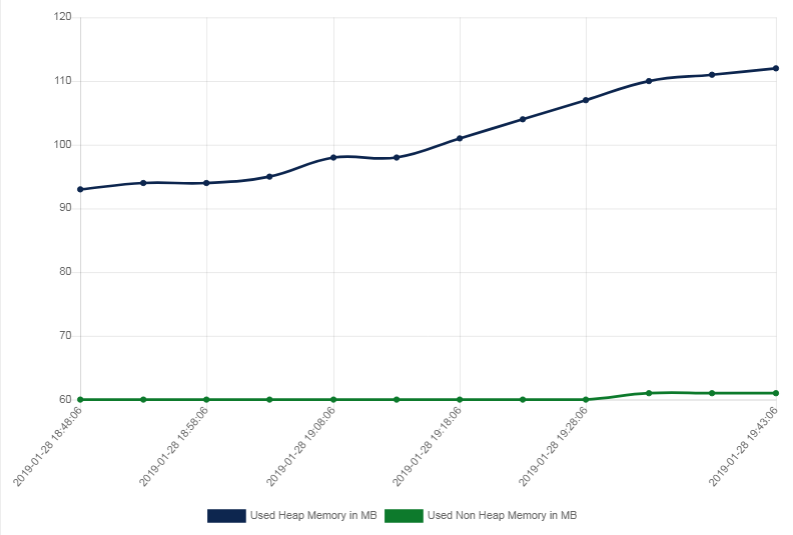
-
Bar

CPU Utilization Graph
Memory Usage Graph
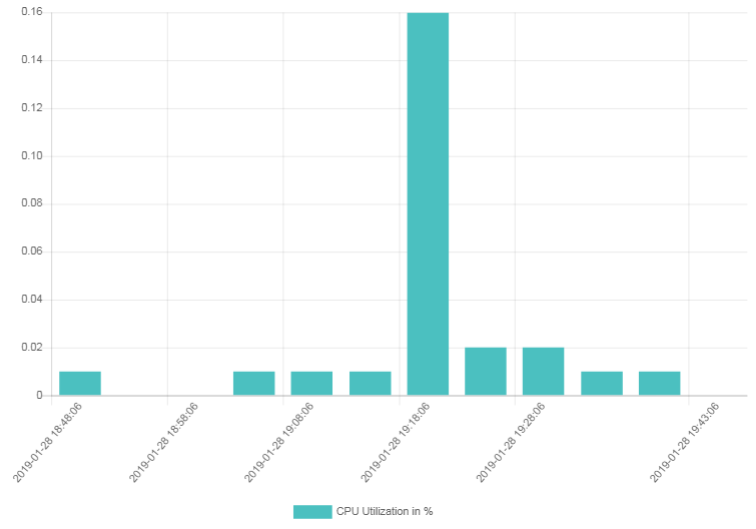
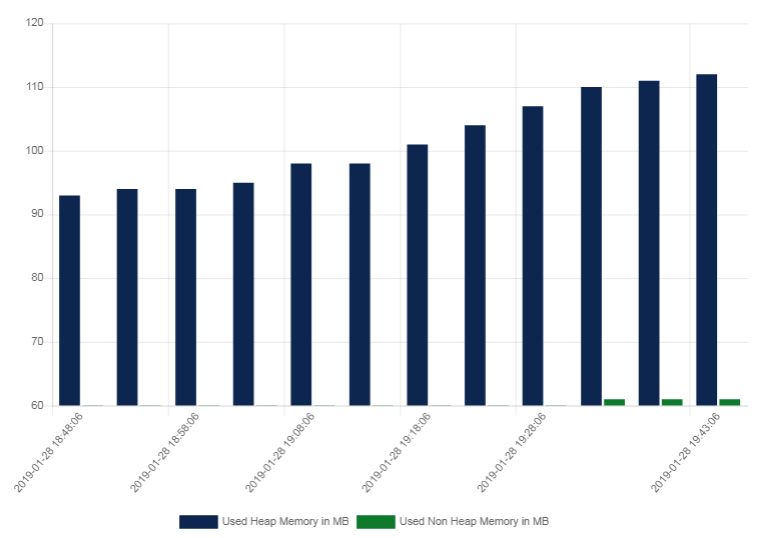
-
Radar
CPU Utilization Graph
Memory Usage Graph
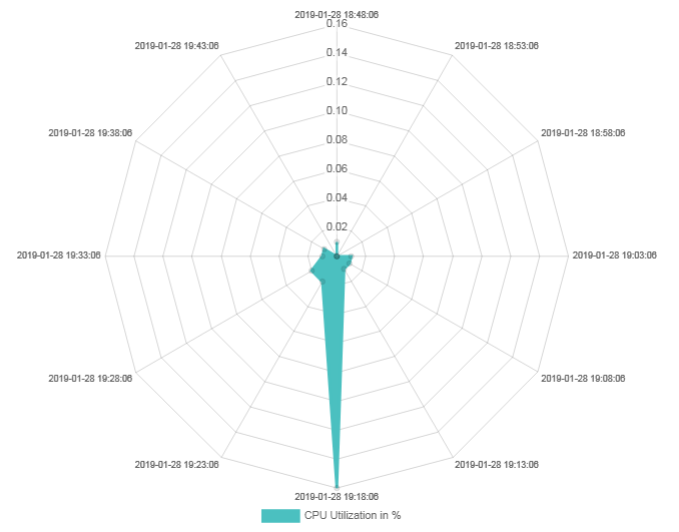
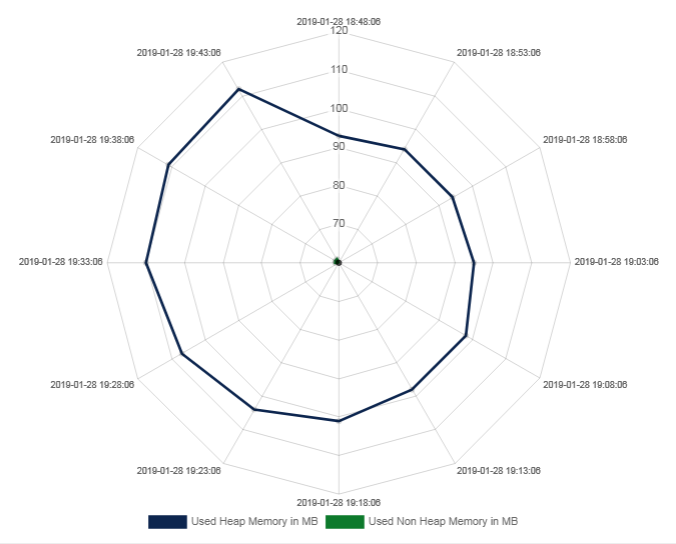
-
Horizontal Bar

CPU Utilization Graph
Memory Usage Graph
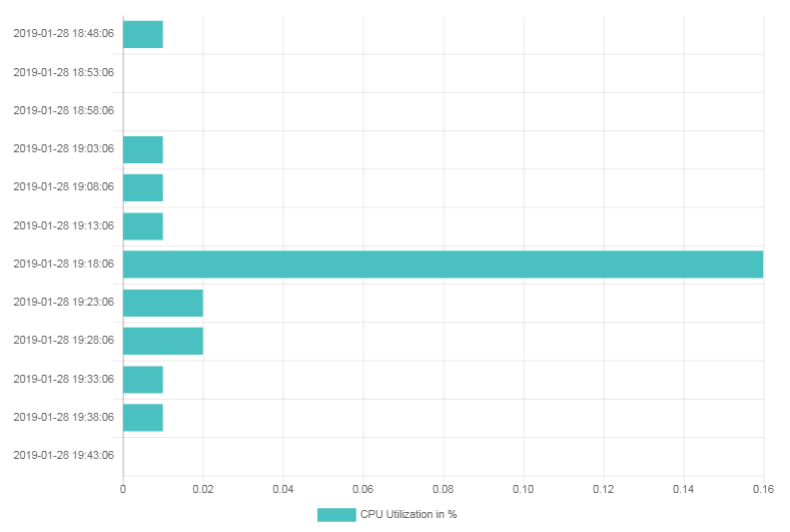
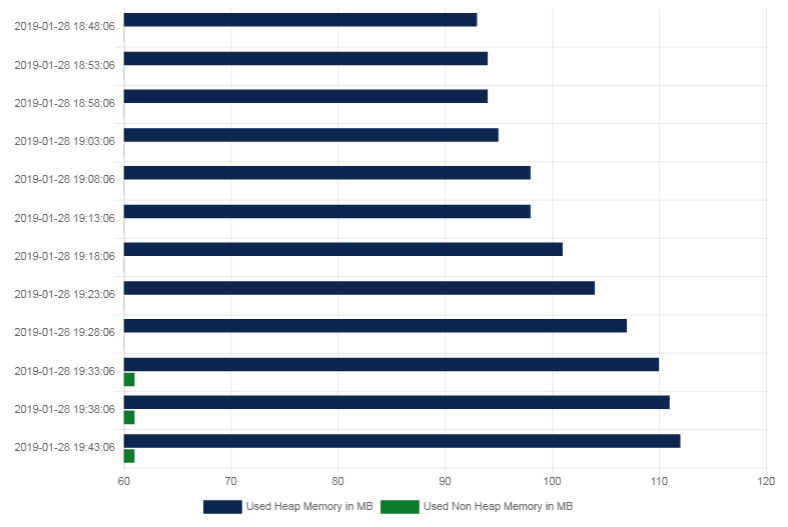
Stopping and Restarting Servers
Stopping Servers
Refer the Shutting down servers section to know how to stop active/passive servers.
Restarting Servers
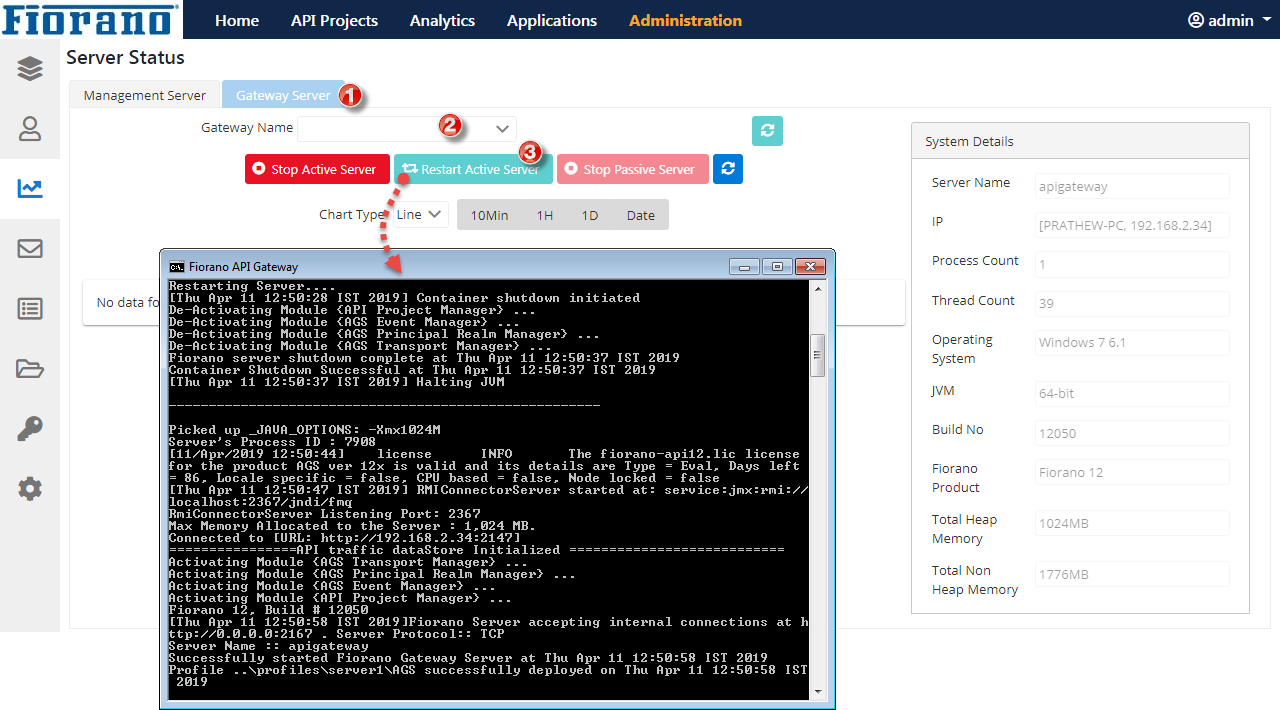
Management Server: Click the Management Server tab and click the Restart Active Server button to restart an active server.
Gateway Servers: Click the Gateway Server tab, select the server name from the Gateway Name drop-down, and click the Restart Active Server button to restart an active server.
Saving Charts
Right-click the graph and click the Save image as option or the Copy Image option to save the graph.