Trace View
Trace View helps to trace HTTP messages sent from an application to a proxy right until a response is received by the application.
Click the Trace View 
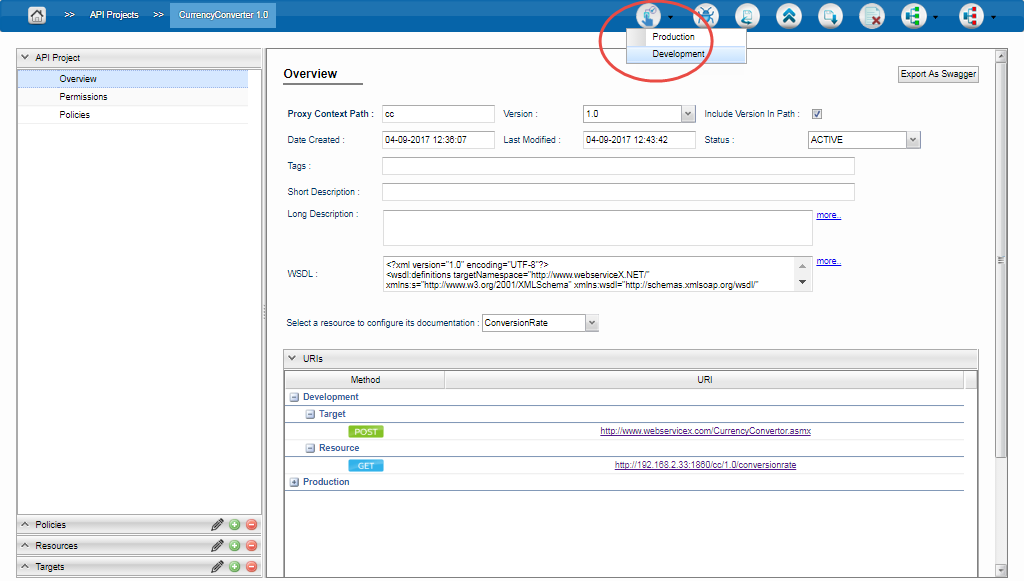
Figure 1: Trace View option inside a project
Clicking the Start Trace Session button present on the upper-left part of the screen starts tracing the request.
As the tracing starts, Stop Trace Session button gets enabled, clicking on which tracing will be stopped.
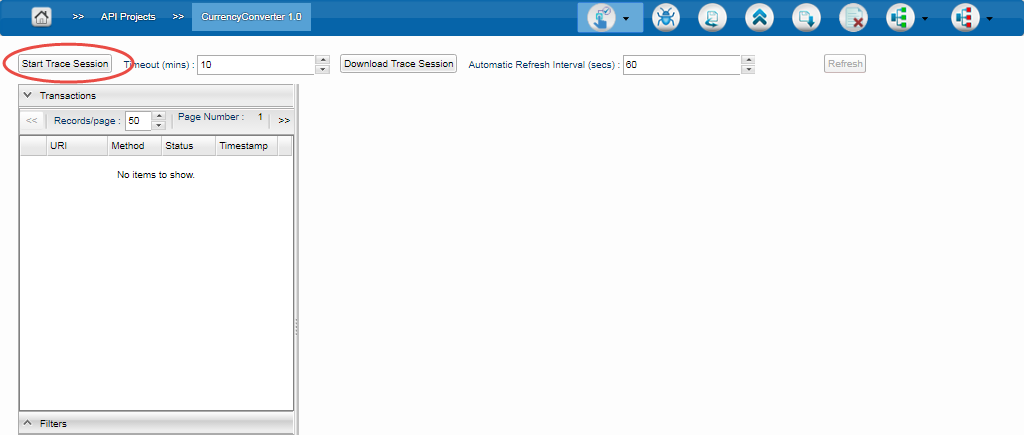
Figure 2: Trace View page with the Start Trace Session option in enabled state
Whenever requests are sent, the details such as URI, Method, Status, and Timestamp appear under the Transactions table. These values get populated following the time interval as configured in the Automatic Refresh Interval or upon clicking the Refresh button.
Provide the Timeout value depending on the time required till the tracing needs to be done. Elapsed Time can be seen next to the Timeout property.
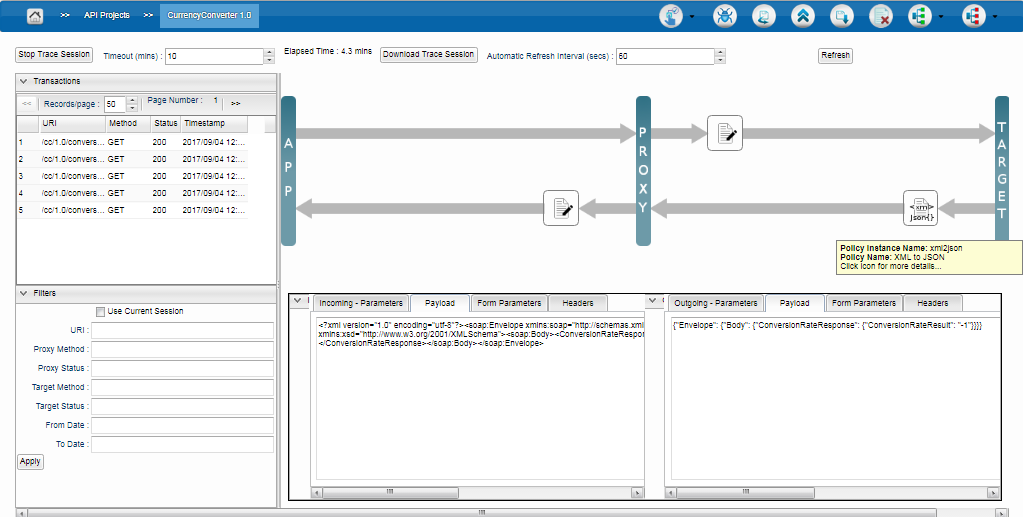
Figure 3: Trace View section in tracing stage
Filtering the Transactions data
Provide the details (URI, Proxy Method, Proxy Status, Target Method, Target Status, From Date and To Date) under the Filters section based on which the transactions need to be traced and then click Apply.
Selecting the Use Current Session option considers only the next session once refresh happens.
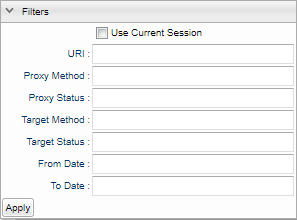
Figure 4: Options to filter transactions
By clicking the policy icon, details of the request before executing the policy as well as after execution will be displayed side by side below the policies. Details such as Incoming/Outgoing Parameters, Payload, Form Parameters and Headers will be displayed.
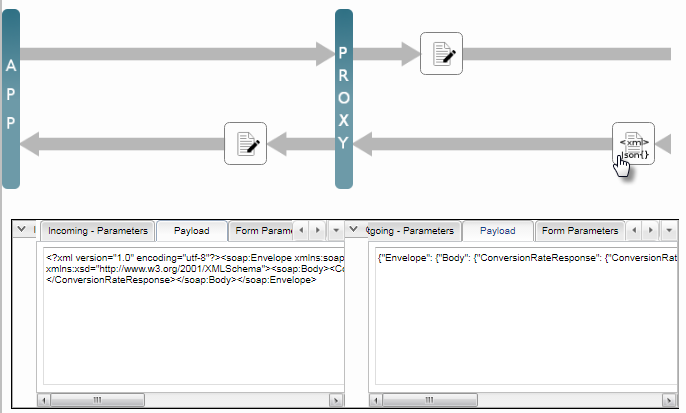
Figure 5: Details of XML2JSON policy displayed
Download Trace Session button helps download the data in JSON format to the designated Download directory.