Chart Type
This option allows viewing various representations of the metrics-specific chart as listed below:
- Line
- Area
- Column
- Doughnut
Select the preferred option from the Chart Type drop-down list present at the upper-left part of the page.
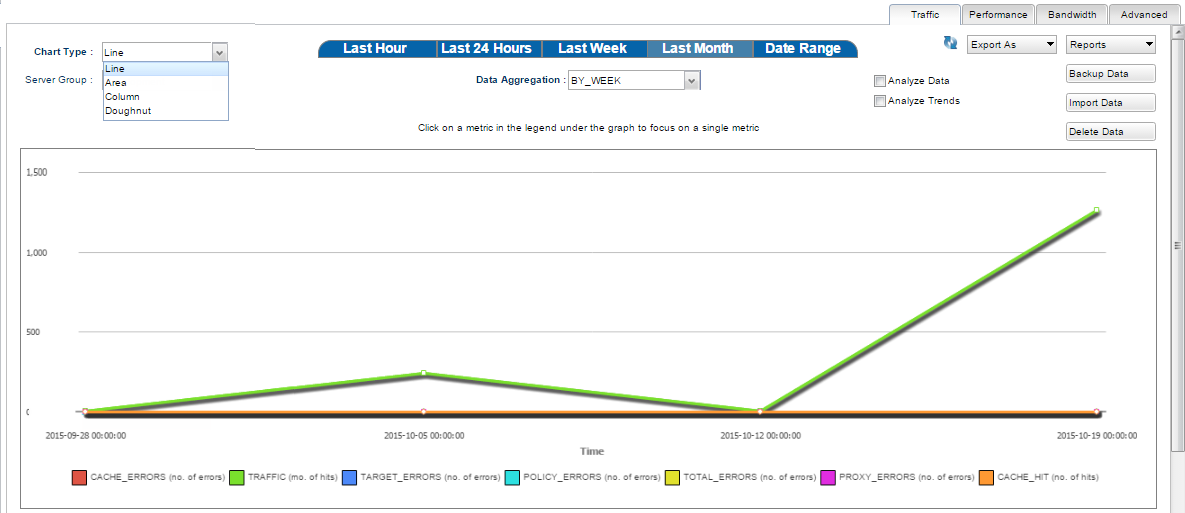
Figure 1: Analytics page with Chart Type drop-down expanded and Line chart displayed
The Analyze Data and Analyze Trends options present at the upper-right part of the screen (just below Export As drop-down) are compatible only with the Line and Area chart types. These options will be in a disabled state for all other types.
Alternatively, the Chart Type can be changed by right-clicking within the graph. There are 3 extra chart types in this menu:
- Bar
- Pie
- Radar
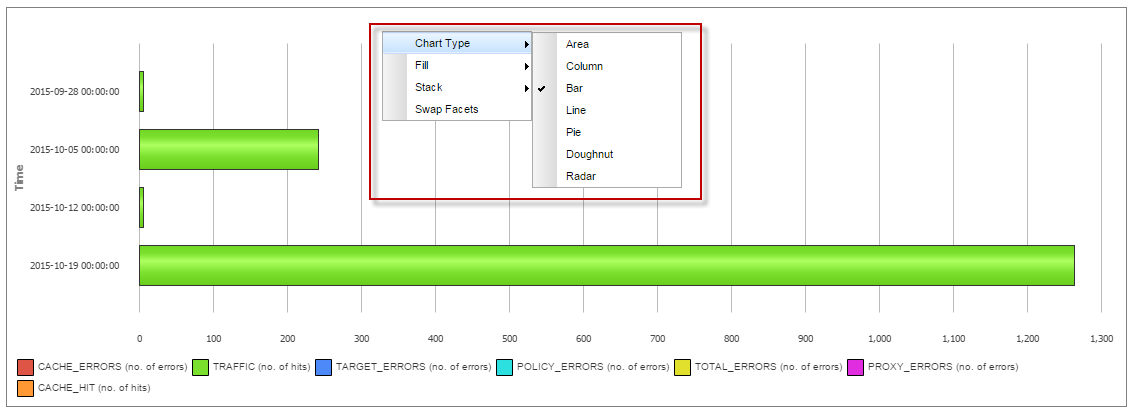
Figure 2: Right-click option to change Chart Type