Analyze Data
This option is used to analyze a specific cross section of a graph. This is particularly useful to analyze any anomalies like peaks in traffic by drilling down using various conditions.
After selecting the criteria, select the required region by clicking the starting point and then the end point; this magnifies the area the area chosen.
The Analyze Data option is only available for Line and Area chart types.
Consider a graph generated using group by condition. To analyze data for a particular minute "14:30" minutes, select the area between 14:00 and 14:38 by following the steps below:
- In the graph, click the small dot on the graph which represents the starting time (14:00). The selected area will be marked by a vertical line.
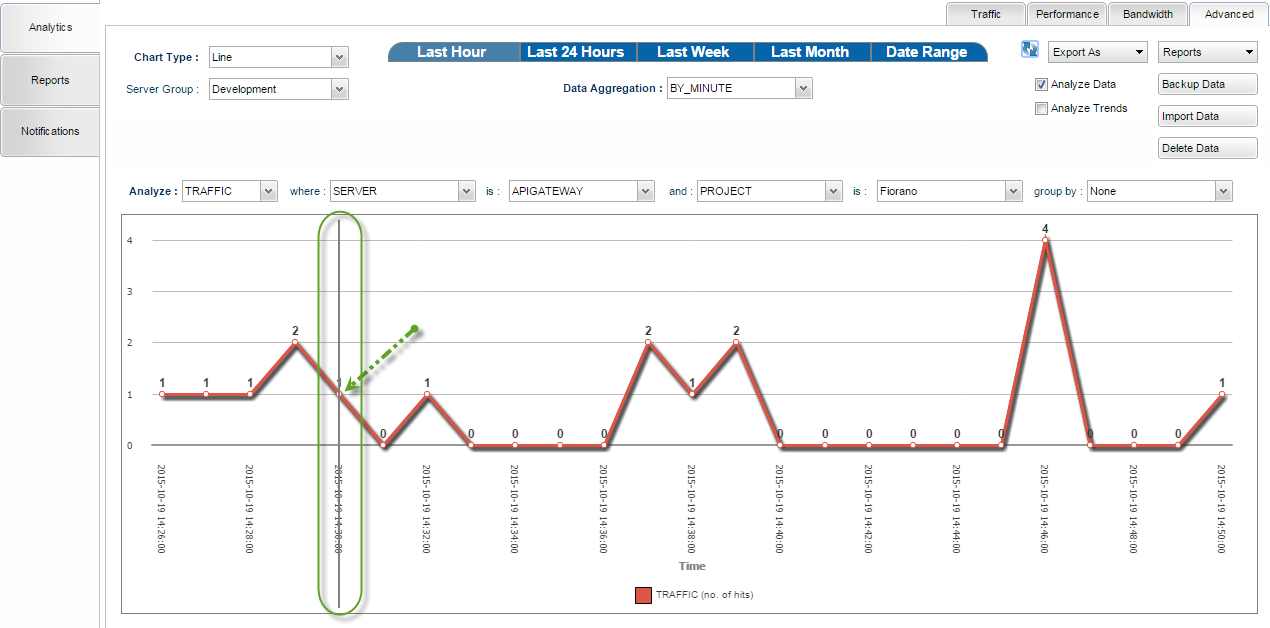
Figure 1: Analytics section with the starting point selected
- Click the small dot that represents the time that is to be the end point (14:38); a magnified form of the selected area of the graph appears.
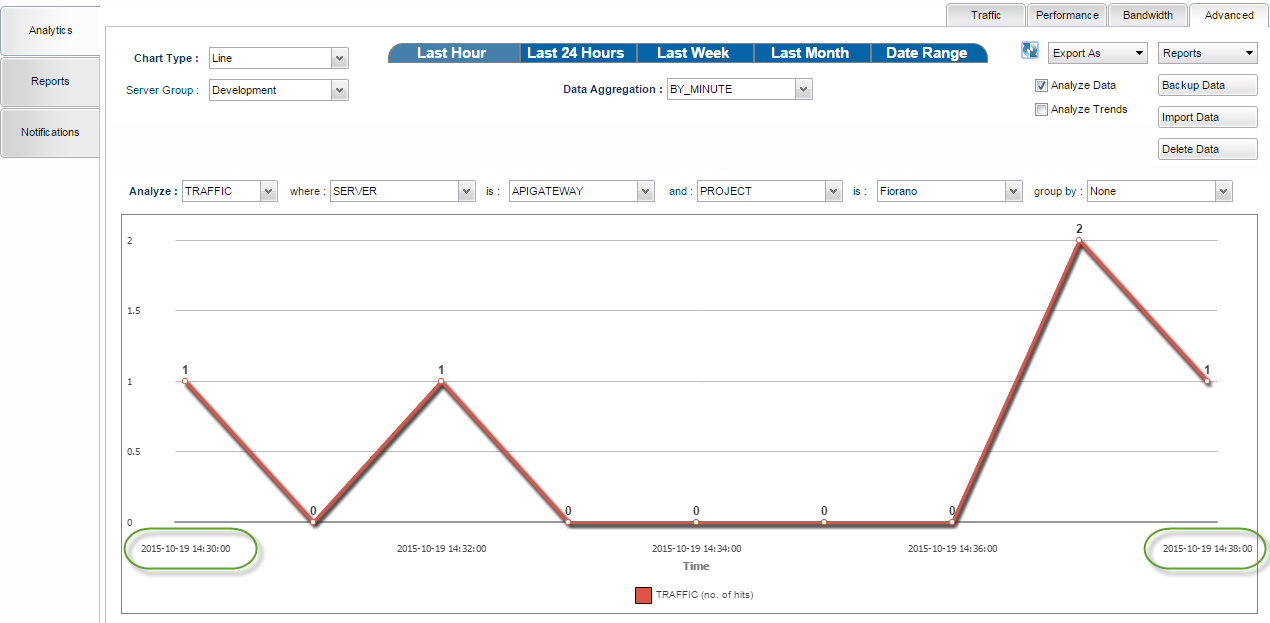
Figure 2: Graph for the selected area, holding data for start time of 14:30 and its end time 14:38
Refreshing Data
It is possible to drill down data based on multiple criteria as well. For example, it is possible to check for requests to a specific API from a particular developer resulting in a certain error.
The refresh button can be used to re-fetch data from the server and re-plot the main representational chart. Notice the difference between Figure 1 and Figure 3. The end time in Figure 1 is 14:50; the data captured after that time is displayed upon clicking the Refresh 
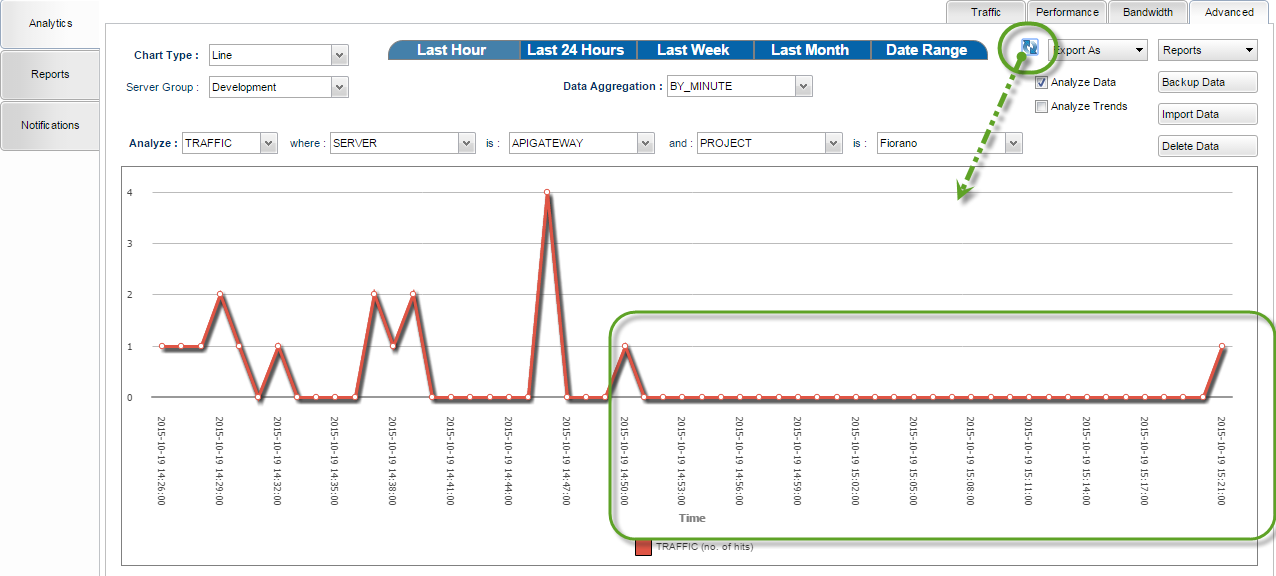
Figure 3: Analytics section with the refresh option highlighted